1

I am writing a thesis on the relationship between gin consumption and health outcomes for my final year at university. After completing my research, I am wondering whether I should have logged some of my control variables.

It is time series panel data.

The two I am concerned about are - total expenditure on healthcare, and income.

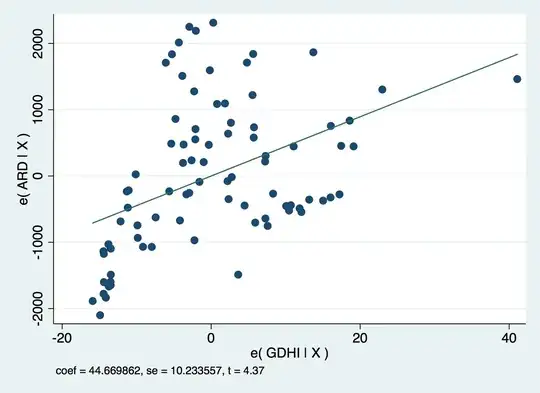
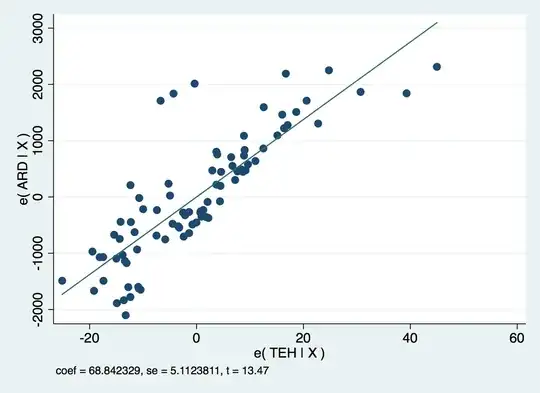
I plotted these variables using added variable plots - which I will attach. They present linear relationships - does this mean I am ok not logging the variables?

Any advise on this matter would be extremely grateful.
enter image description here

enter image description here

kjetil b halvorsen
  • 63,378
  • 26
  • 142
  • 467
  • is this time series data i.e. chronological ? – IrishStat Apr 30 '19 at 10:54
  • Hi - yes - its time series panel data. – Carys Wright Apr 30 '19 at 11:39
  • 1
    You might want to look at a piece I wrote a long time ago entitled "Regression vs Box-Jenkins" https://autobox.com/pdfs/regvsbox-old.pdf and my most highly saluted post on SE https://stats.stackexchange.com/questions/18844/when-and-why-should-you-take-the-log-of-a-distribution-of-numbers . – IrishStat Apr 30 '19 at 12:00
  • 1
    Neither relationship looks linear to me. The second one is highly heteroscedastic and nonlinear (look at the bottom left). The first one has obvious curvature. The meanings of the values on these plots are obscure, because obviously neither one reflects the logarithm of the other: you cannot take logarithms of negative values. For a discussion of when to take logarithms of variables in regression, see https://stats.stackexchange.com/questions/298. – whuber Apr 30 '19 at 12:16
  • Does the line of best fit not represent a linear relationship? Sorry I am slightly confused as that's what I thought that meant. – Carys Wright Apr 30 '19 at 12:47
  • 1
    This "line of best fit" obviously is a poor fit! Although you can fit a line to any scatterplot, that doesn't mean the result is meaningful or useful. Its existence certainly doesn't imply the relationship ought to be characterized as "linear." – whuber Apr 30 '19 at 13:35
  • Ah okay - thank you. Do you know why an added variable plot is useful in determining whether to use log or not? (I am confused - as many papers say it is useful in determining functional form - but how). – Carys Wright Apr 30 '19 at 13:42
  • 1
    There is an excellent discussion of this topic here: https://stats.stackexchange.com/questions/298/in-linear-regression-when-is-it-appropriate-to-use-the-log-of-an-independent-va – James Phillips Apr 30 '19 at 14:55
  • Hi there - I have taken the decision to log my variables but it has dramatically changed my results? Is there any reason why? – Carys Wright May 01 '19 at 07:51

0 Answers0