I have a data set in which I measured a continuous variable (positive, continuous data) in response to different treatments(15 different pathogens) and I am unsure how to statistically analyse the data. In response to some treatments, the dependent variable is normally distributed, but in others not and the usual transformations that are often applied do not result in a normal distribution among all treatments. Moreover, there is quite some variation in the data and variances are not homogenous. Could a generalized linear model be a good possibility or am I overlooking a much more simple solution? Thanks a lot in advance!
-
1What specific questions do you want to answer by the analysis? – Michael M Apr 29 '19 at 17:45
-
My apologies for not specifying this. Basically, I just want to know which of my treatments is significantly different to a control. Multiple t-test comparisons between control and each of the treatments would actually do the job. – Robert Apr 29 '19 at 17:53
-
If the variances are correlated with control variables you have an issue – Aksakal Apr 29 '19 at 18:50
-
You wont really have a basis to asset that the conditional distribution of your response *is* normal. Perhaps the data look normalish, or perhaps you conducted a [goodness of fit test](https://stats.stackexchange.com/questions/2492/is-normality-testing-essentially-useless) - but failure to reject doesn't make the null true. – Glen_b Apr 30 '19 at 02:50
1 Answers
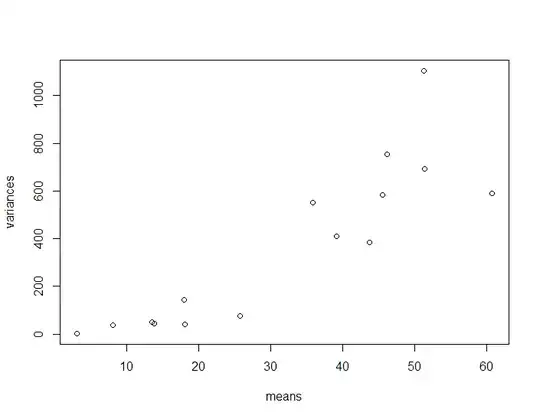
Yes, generalized linear models could be a good idea here. It comes down to whether or not you can find a suitable exponential family. First, I would plot the fitted values against the variance for all 15 categories. In a toy example(10 observations per treatment) it may look like this
 This gives you an idea of the variance function, $V(\mu)$. The goal is then to find an exponential family which yields a similar variance function (See for example tweedie class). In the plot, the variance function is $V(\mu)=\lambda \mu^2$ which corresponds to a gamma distribution. If you find a suitable exponential family and the residuals of the GLM looks fine, you can use the GLM to make t-test for all your pairwise comparisons.
Alternatively, you can use pairwise rank tests to see if there is difference between the groups. Perhaps it is even better to use the rank tests than the GLM because you do not have to do model checking with rank tests.
- 668
- 3
- 13
-
Would a Pairwise Wilcoxon Rank Sum Test not also require homogenous variances? – Robert May 01 '19 at 11:31
-
@Robert Partly; If there is homogeneity of variances, you can make stronger conclusions from the wilcoxon test. But you can still make conclusions if there is not homogeneity of variances. See https://stats.stackexchange.com/a/113350/89277. – svendvn May 01 '19 at 12:04