I am using a toy example to explain power calculations for a t-test
Let's say we have two populations where we measure a certain parameter. Population A has a mean of 0 and population B has a mean of 3, both with a sd of 2. The effect size is 1.5
I use the pwr package in R to do the power calculation as such
library(pwr)

pwr.t.test(n = NULL, d = 2/3, sig.level = 0.05,
           power = 0.9, type = "two.sample",
           alternative = "two.sided")

Two-sample t test power calculation

          n = 48.26427
          d = 0.6666667
  sig.level = 0.05
      power = 0.9
alternative = two.sided

NOTE: n is number in *each* group
So, R is suggesting 48 observations per group, to get a power of 0.9
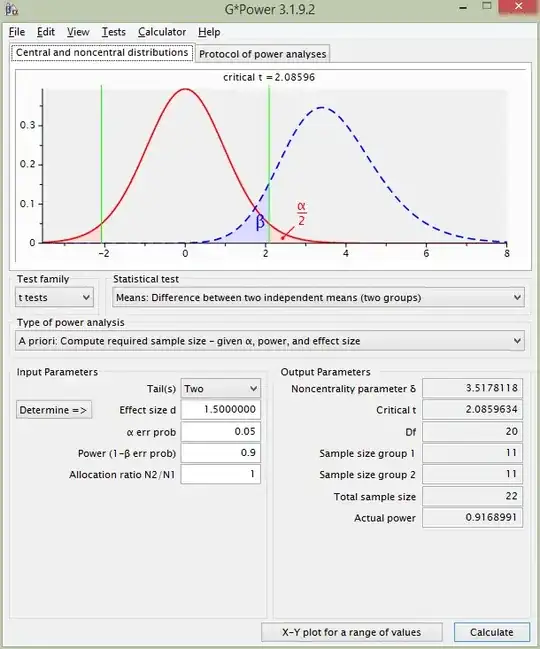
If I repeat the calculation using G*Power, however, I get this, which suggests 11 observations per group!
Finally, if I use this online tool from the University of British Columbia I get 10.
I can understand that rounding errors may bring you from 10 to 11... but why is R giving me such a high value?
Indeed, if I do a little simulation, it looks like 10 or 11 observation give you a power of ~90%
n <- 10

res <- sapply(1:1000, function(x)
  {
  a <- rnorm(n, 0, 2)
  b <- rnorm(n, 3, 2)
  res <- t.test(a, b, alternative = "two.sided")
  res$p.value
  })

table(res<=0.05)

FALSE  TRUE
  115   885    <-- 88.5% power
n = 48 always gives me a power of 100%... am I missing something?
