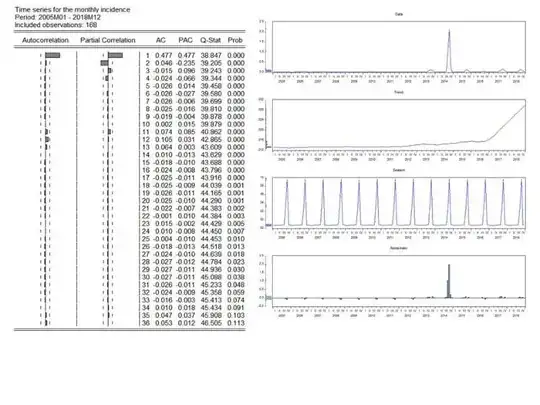
These are the monthly plot produced by eviews. Why is the discrepancy happened? Also the X-12 says identifiable seasonality is not present using F test for seasonality. Can I say that the seasonality does not exist in the data? What is the oscillation pattern at the seasonal decomposition?
Asked
Active
Viewed 47 times
0
-
I can't read the y axis labels on your plot, but I strongly suspect that the seasonal component has very small values. A decomposition will show a component that fills the entire vertical plot area *regardless of how strong the seasonality is*. – Stephan Kolassa Apr 18 '19 at 06:24
-
Thank you for your comments! – jomin27 Apr 18 '19 at 07:31