10

I'm working with a large set of accelerometer data collected with multiple sensors worn by many subjects. Unfortunately, nobody here seems to know the technical specifications of the devices and I don't think they have ever been recalibrated. I don't have a whole lot of info about the devices. I'm working on my master's thesis, the accelerometers were borrowed from another university and altogether the situation was a bit intransparent. So, preprocessing on-board the device? No clue.

What I do know is that they are triaxial accelerometers with a 20Hz sampling rate; digital and presumably MEMS. I'm interested in nonverbal behavior and gesturing, which according to my sources should mostly produce activity in the 0.3-3.5Hz range.

Normalizing the data seems quite necessary, but I'm not sure what to use. A very large portion of the data is close to the rest values (raw values of ~1000, from gravity), but there are some extremes like up to 8000 in some logs, or even 29000 in others. See the image below. I think this makes it a bad idea to divide by the max or stdev to normalize.

What's the usual approach in a case like this? Divide by the median? A percentile value? Something else?

As a side issue, I'm also not sure if I should clip the extreme values..

Thanks for any advice!

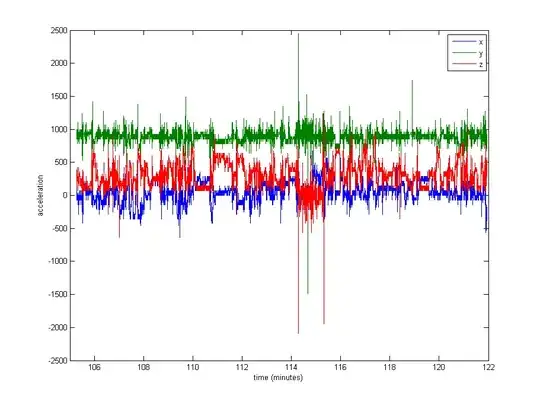
Edit: Here is a plot of about 16 minutes of data (20000 samples), to give you an idea of how the data is typically distributed.

enter image description here

Junuxx
  • 245
  • 2
  • 3
  • 12
  • 1
    Can you provide a little more information on your measurement setup? Questions that come to mind: (**1**) Are these single-axis accelerometers or multi-axis? (**2**) Are they high-pass filtered or not and, if so, how? (It sounds like they are not, based on your description.) (**3**) What exactly are you measuring and what is the frequency range of the signal of interest? (**4**) What is the sensing mechanism (i.e., MEMS, piezoelectric, capacitive, etc.) or, even, part number(!) of the accelerometers you are using? ... – cardinal Oct 14 '12 at 01:50
  • ... (cont) (**5**) Are these fully digital or do you have your own ADC (16-bit, maybe, by the description you give)? – cardinal Oct 14 '12 at 01:50
  • @cardinal: I edited in the answers to your questions, thanks for asking. Not sure what an ADC is. I was involved in the experiment, but not in the extraction of the data from device memory, there's a gap between data collection and where I received a bunch of binary logs. – Junuxx Oct 14 '12 at 02:18
  • Hi, Junuxx. Sorry for the unexplained acronym (ADC="analog-to-digital converter"); I implicitly assumed you'd recognize it based on your question. – cardinal Oct 14 '12 at 02:23
  • @cardinal: Ah, right. Does it matter for the normalization issue whether it's fully digital? – Junuxx Oct 14 '12 at 14:21
  • 1
    What are you trying to find out from these data? Are you perhaps trying to detect certain kinds of events, estimate frequencies of events, estimate mean accelerations, find correlations among different accelerometers, ...? The point is that if you would like good, relevant advice, don't ask about technical procedures with the data (which may be irrelevant or even useless, depending on the application): first tell us what *problem* you are trying to solve. – whuber Oct 14 '12 at 15:01
  • @whuber: As stated in the question I'm interested in gestures and social behavior. I'm using several machine learning techniques (HMMs, SVMs and others) to classify behavior types such as hand gestures, speech, laughter from this data. Also walking and a few postures for variety. I have some reasonable results already, I'm trying to understand whether some type of normalization could/should improve results. Dividing by the max for every subject looks like a bad idea here. I tried subtracting the mean but it did not have a noticeable effect. – Junuxx Oct 14 '12 at 15:26
  • Thanks. However, I still haven't seen enough information to answer the question: without knowing about the specific techniques you intend to use and what kinds of data characteristics you are looking for in order to identify and classify "behaviors" based on *acceleration components,* it's impossible to say whether standardization is needed or what kind of standardization might help. – whuber Oct 14 '12 at 15:29
  • @whuber: Well it varies really; the goal is compare a host of features and classifiers. But I'm training and testing on short windows of data, say 1-5 seconds, which I've manually annotated. Features include the windows' mean, standard deviation, skewness, kurtosis, and also FFT magnitudes. All features can be computed for each axis separately, or from the vector magnitude. So that's up to 12 features from the time domain and, in most cases, 21 features from the frequency domain per instance/window. Sorry for not being clear enough in the first place; don't mean to be a help vampire! – Junuxx Oct 14 '12 at 15:35
  • No problem. The situation is getting clearer, but I'm having a hard time seeing how any of those features would be related to gestures (except possibly some of the FT amplitudes). Wouldn't you be chiefly interested in detecting the occurrences of short, large accelerations and perhaps also in knowing their directions? – whuber Oct 14 '12 at 15:41
  • How did you get to synchronise all the multiple sensors. By this I mean how did you get data from all the sensors at a certain time t, without delays or misreads. Meaning at time t you have the corresponding precise values for that instant from all the sensors. Regards, – Undroider Oct 29 '15 at 22:32
  • The sensor devices we used were all wirelessly connected to nodes which sent pulse signals for synchronization. – Junuxx Oct 29 '15 at 22:43
  • yes, but how did you treat those signals/messages arriving from those nodes? what programming language did you use? My concern is when I save the data. I want to associate it with a timestamp. If I have several nodes transmitting I want to make sure I get the data from all the sensors in the same instant. – Undroider Oct 29 '15 at 22:49

1 Answers1

15

The raw signals you show above appear to be unfiltered and uncalibrated. Appropriate filtering and calibration, with some artifact rejection will in effect normalize the data. The standard approach with accelerometer data is the following:

  1. Filter - e.g. 4th order, zero-phase IIR lowpass or bandpass filter
  2. Artifact rejection - threshold based
  3. Calibrate - Ferraris et al method (Procedure for effortless in-field calibration of three-axis rate gyros and accelerometers, F Ferraris, U Grimaldi, M Parvis - Sensors and Actuators, 1995) method works well for this.

It is advisable to perform artifact rejection on inertial sensor data. I would be concerned that you don't know the provenance of the data, and so you cannot guarantee that the sensors were affixed correctly and consistently (in terms of orientation and physical placement) to all subjects. If the sensors were not affixed correctly, you can get a lot of artifact in the signals, as the sensor can move relative to the body-segment. Similarly, if the sensors were orientated differently (in how they were placed) on different subjects, the data will be difficult to compare across subjects.

Given the size of the outliers you report they seem likely to be artifacts. Such artifacts would almost certain skew any calibration calculation (though their effect will be lessened by appropriate filtering) and so calibration should be performed after artifact rejection.

A simple threshold may work well for an initial artifact rejection routine, i.e. remove (or replace with NaN) all samples above a certain empirical threshold. More sophisticated techniques will adaptively calculate this threshold using a running mean or moving window.

Depending on the location of the sensor you may also wish to correct for the influence of gravity on the acceleration signals, though detailed understanding on sensor axes and positioning is crucial here. The Moe-Nillson method (R. Moe-Nilssen, A new method for evaluating motor control in gait under real-life environmental conditions. Part 1: The instrument, Clinical Biomechanics, Volume 13, Issues 4–5, June–July 1998, Pages 320-327) is the most commonly used and works well for lower back mounted inertial sensors.

A good place to start on examining the data for gesture recognition would be to break the filtered, calibrated data into epochs (e.g. 10s) and calculate a number of features per epoch and relate these to the labels you have for the data, I can't offer more specific advice without knowing more about the data set and the associated labels.

Hope this helps.

BGreene
  • 3,045
  • 4
  • 16
  • 33
  • That's an amazing reply @BGreene, thank you very much! References are very useful too. I wish I had asked this question a few months ago. The sensors were worn on a cord around the neck (not my idea), so there is definitely a lot of movement relative to the body. Some of your suggestions might be more suitable for further research I think, but at least they'll be helpful for my Future Work section. And fortunately the recognition part is not the problem, I do have a fairly solid background in machine learning, but thanks for the suggestions on that too. – Junuxx Oct 14 '12 at 21:46
  • No problem. In that case I'll think you'll be limited to examining gross movements as a cord means that you can't reliably say how the body was moving, only the sensor. You could possibly infer that large sensor output values equate with large gross movements but you do lose a lot the crispness of a properly affixed sensor. – BGreene Oct 14 '12 at 22:06
  • (+1 yesterday) A couple of things might be taken into account in (1.) above. Since the lower bound of the frequency range of interest is pretty small, one alternative to consider is simply to apply a low-pass filter and subtract the mean. Second, instead of an IIR filter, one might consider a linear-phase finite-impulse-response filter in this instance. I say this because I suspect that to predict gestures by using the multi-axis accelerometer signal, one will want to keep the movement synchronized independently of frequency. (cont.) – cardinal Oct 16 '12 at 16:42
  • (...) The nonlinear phase response of an IIR filter will shift different components by different amounts and this effect tends to be worse near the cutoff frequencies. Since everything is digital, it makes sense to go with a linear-phase FIR filter. Oftentimes one also has better control of the transient response as well. :-) – cardinal Oct 16 '12 at 16:43
  • @cardinal thats all true - have edited my response above. just checked my code - my most recent accelerometer algorithm uses a zero-phase Butterworth IIR filter. Though I prefer to avoid subtracting the mean for short data segments – BGreene Oct 16 '12 at 16:46
  • @BGreene: Thanks for your follow-up remarks. I see my comment on subtracting the mean may not have been as clearly stated as I intended. I simply meant that as an alternative (in conjunction with a LPF) to a bandpass filter, in effect only removing the DC component instead of rolling off at low frequencies which might distort some of the desired signal of interest given its low frequency. Nice answer. :-) – cardinal Oct 16 '12 at 17:01