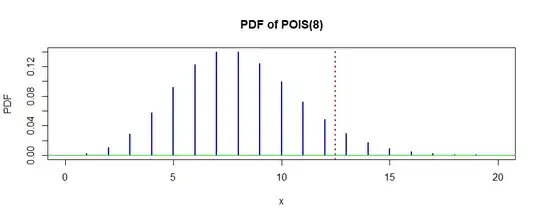
The situation I have is with data that (I'm assuming for now) follows a poisson distribution. I want to know if this year had an unusual number of a certain type of fatality compared to previous years. I could use a hypothesis test to evaluate if this result is unusual. If the average rate in previous years was 8 fatalities per year, and last year there were 13 fatalities:
Null hypothesis: λ = 8 Alternative hypothesis: λ > 8 Using a cumulative poisson distribution table, I can see that P[x>=13] = 0.0342 when λ = 8 is, so the result is statistically significant at the 0.05 level.
However, I only have a few years of data with which to estimate my null hypothesis λ = 8. I know that the standard error for my estimate is sqrt(λ/n) - how do I include this extra uncertainty in my hypothesis test?
Thanks!
Edit: Thanks everyone for your responses so far. Some have asked for specifics of the data I am looking at. I actually want to stay away from solutions for specific data since this is a business question that comes up a lot in with different types of accidents and with different numbers of years available, and I'm looking for a good general solution. If it helps, lets say I always have between 7 and 15 years of data to give me my null hypothesis lambda.
