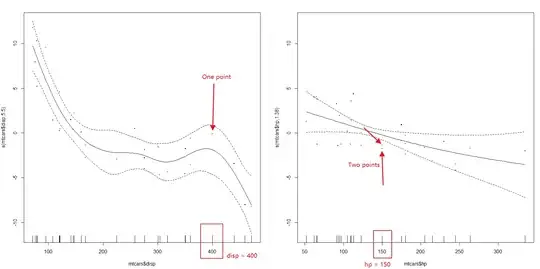
Take mtcars as an example. I build a GAM model between mpg (dependent variable) and disp and hp (independent variables), and plot the partial residual plots:
library(mgcv)
gam2 <- gam(mtcars$mpg ~ s(mtcars$disp) + s(mtcars$hp), family = gaussian)
plot(gam2, page = 1, residuals = TRUE, cex = 2.5)
In the picture  , I can see for "disp = 400", there is one point; for "hp = 150", there are two points. The X value is consistent with the dataframe:
                 mpg  disp  hp
Pontiac Firebird 19.2 400.0 175
Dodge Challenger 15.5 318.0 150
AMC Javelin      15.2 304.0 150
There is an existed question similar to me, and fabians said we can make plot.gam return an object:
pd <- plot(gam2, page = 1, residuals = TRUE, cex = 2.5)
I think the rug in X axis is pd[[i]]$raw for ith plot. However, I am confused about: (1) where are Y values stored in pd; (2) or are the Y values of "ponits" are calculated, instead of directly stored in pd?
About Question 1, I find that Y axis of dots are pd[[i]]$p.resid. Can someone give me advice on how these values are calculated (i.e., Question 2)? Why these dots can represent the "partial effects" of the independent variables?