1

I was given 2 forecasts: Scenario 1 and Scenario 2 for EU GDP. How can I calculate 2 scenarios (forecasts) for Germany GDP? a) There is a strong correlation between (historic) EU GDP and Germany GDP b) EU GDP is impacted by Germany GDP.

At first I thought that I can predict Germany GDP using sARIMA and later to apply shocks from scenario 1 or scenario 2 to the predicted germany gdp data. However, I am not sure how to make different shocks between EU and Germany, should I scal them using correlation? Any ideas or hints are welcome.

[edit] Added data CSV files

There are 2 CSVs:

a) Example_historic.csv with historic data for Germany and EU

b) Example_forecasts.csv with 2 scenarios for the EU.

Goal: how to build 2 forecasts for Germany?
Lohengrin
  • 47
  • 6
  • Please post the forecasts you were given ... and also post the historical data for both series – IrishStat Mar 26 '19 at 22:55
  • your two scenarios seem identical i.e. the predictions for the euro gdp are the same for the next 12 quarters. – IrishStat Mar 28 '19 at 12:17
  • Just to clarify: data between 1980 and 2018 are historic. 2019 - 2021 are forecasts. There are 2 scenarios for EU GDP and 2 missing for Germany. – Lohengrin Mar 29 '19 at 06:24
  • They look the same to me ... can you simply post these 24 values 12 quarterly values for each scenario over 3 years – IrishStat Mar 29 '19 at 07:26
  • [![enter image description here](https://i.stack.imgur.com/U948w.png)](https://i.stack.imgur.com/U948w.png) The second nd third rows are your future values for the euro gdp. They are the same. – IrishStat Mar 29 '19 at 13:16
  • I have splitted the file into 2. The previous version might be confusing. – Lohengrin Apr 16 '19 at 12:37

1 Answers1

0

I introduced your 156 months of data to AUTOBOX which developed a SARIMAX model How to predict the next number in a series while having additional series of data that might affect it? .

The cross-correlation analysis using the pre-whitened series suggested a contemporaneous relationship between the two series. A few anomalous data points were detected along with two downwards level shifts viz 1993/2 and 2006/2 .

The useful equation is here enter image description here with residual plot here enter image description here

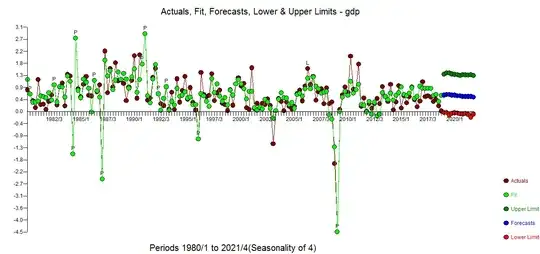
The Actual/Fit and Forecast using scenario 1 is enter image description here with forecasts here enter image description here

while using scenario 2 we get enter image description here and enter image description here

The model is presented here enter image description here

IrishStat
  • 27,906
  • 5
  • 29
  • 55