When computing hierarchical clustering over a data matrix, a dissimilarity matrix is first computed in order to build the tree (dendrogram). For example:
library(pheatmap)
data(iris)

# Make a heatmap
rownames(iris) <- paste0("r", 1:nrow(iris))
p1 <- pheatmap(iris[, 1:4], annotation_row = iris[,5, drop=FALSE])
# Explicitly compute the tree and verify it's equal to the one on the plot
dmat <- dist(iris[,1:4])
tree <- hclust(dmat)
identical(tree$height, p1$tree_row$height)
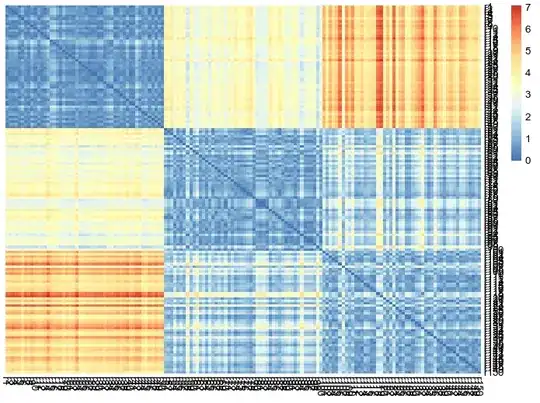
Let's say I am interested in visualizing the (dis)similarities of the observations with respect to other observations, and therefore I plot the heatmap of the distance matrix directly.
Question: is it a valid thing to do to overlay the tree of the first plot over the distance matrix plot directly? Or is it misleading? For example:
# Plot the distance matrix with the previous tree
pheatmap(as.matrix(dmat),
         clustering_distance_rows = dmat,
         clustering_distance_cols = dmat)
The confusion arises from the fact that we could actually run hierarchical clustering over the distance matrix as the input data (i.e. internally, this would mean to compute a distance matrix on the distance matrix), and the obtained tree would be different. I believe that in that case, this tree would answer the question of "how similar the observations are with respect to their distance to other observations?", whereas the tree on the input data answers "how similar are the observations with respect to their features?" Is this understanding correct?


