This answers your question
Does the "blue distribution" have a larger variance?
and does not address the broader answer. I recommend this post as a start point.
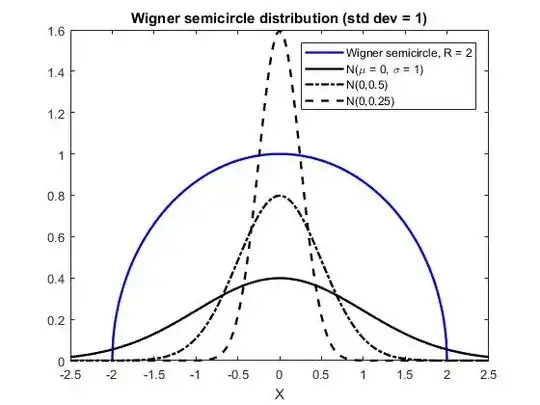
The "blue distribution" is the Wigner semicircle distribution.
In the figure below, $R=2$ which implies that if $X\sim \text{WignerSemicircle}(R)$, then $\text{var}(X) = \frac{R^2}{4}=1$. You can compare that with different Normal (Gaussian) distributions with the same mean but different variances. Note the standard deviation is given in the plot legend.
It appears your "blue distribution" has a larger variance than the "black distribution."
% MATLAB R2017a
R = 2;
fh=@(x) 2*(1./(R^2)).*sqrt((R^2) - (x.^2));

X = -2:.01:2;
XN = -2.5:.01:2.5;

figure, hold on
plot(X,fh(X),'b-','DisplayName','Wigner semicircle, R = 2')
plot(XN,normpdf(XN,0,1),'k-','DisplayName','N(\mu = 0, \sigma = 1)')
plot(XN,normpdf(XN,0,0.5),'k-.','DisplayName','N(0,0.5)')
plot(XN,normpdf(XN,0,0.25),'k--','DisplayName','N(0,0.25)')
legend('show')

