2

In statistics, different orders of moments are tools to characterize a distribution, for example mean, covariance, skewness etc., which also gives an intuitive way to visualize the distribution.

But are there any math tools to account for the "multi-modality" of a distribution?

For example, given a (multimodal) distribution, how to define the information of the modality?

enter image description here

Nathan Explosion
  • 354
  • 2
  • 11
  • I believe https://stats.stackexchange.com/a/428083/919 may have answered this question: what do you think? – whuber Sep 16 '20 at 12:36
  • @whuber No. The question you linked were asking how to get the peak value of an n-modal distribution, while my question asks how to measure the modality (level of peaks, distance between peaks, spread of distribution etc.) of a distribution. – Nathan Explosion Sep 16 '20 at 12:38
  • But mustn't any such measurement first require defining a "peak" and identifying the peaks? Everything will flow from that. Because you include the [tag:descriptive-statistics] tag, presumably you are asking about a *data* distribution. Your graphic suggests you are thinking of the data as being sampled from a *continuous* underlying distribution. In such cases there is no data "mode," because almost surely every data value is unique. That's why the thread I linked to looks like it addresses the crux of the matter. – whuber Sep 16 '20 at 12:54
  • @whuber The tag descriptive-statistics is confusing people here, which should be deleted. My question is not concerned with data (i will edit it). I'm saying to build a "measure" to model the modality of a given distribution. For example, the mean "measures" the average of a distribution, and the covariance "measures" the spread of a distribution. – Nathan Explosion Sep 16 '20 at 12:59
  • Then this question needs more focus and we need more guidance from you, because when a PDF is mathematically given, its modes -- the local extrema -- are defined, but what then? Exactly what property of the PDF do you need to characterize? Besides describing the modes, what do you mean by "account for" in your question? – whuber Sep 16 '20 at 13:08
  • @whuber I agree. Concepts like local extrema, mean, and covariance are indeed defined. I'm not sure about the whole picture of "information of the modality" which could, possibly include e.g., "how many local minima, spread of each local minima". So the question isn't focusing on a specific modality measure but asking what could be used to present such.similar information. The answer by Firebug gives a good example when you know the distrubiton is bimodal. – Nathan Explosion Sep 16 '20 at 13:22
  • I provided three summary statistics that measure the degree of bimodality, given either the PDF, the histogram or the samples themselves. Is there anything more to it? – Firebug Sep 16 '20 at 14:15

2 Answers2

2

Wikipedia gives several summary statistics for bimodality. I will give some useful examples:

Sarle's bimodality coefficient

Reminiscent of a proposal by Pearson's, it builds on the idea that bimodal distributions present low kurtosis, high skewness, or both at the same time. $\gamma$ is the skewness while $\kappa$ is kurtosis. $\beta \in [0,1]$. $\beta = 5/9$ for uniform and exponential distributions. Values greater than that indicate bimodality.

$$ \beta = \frac{\gamma^2+1}{\kappa} $$

Ashman's D

$D$ measures the degree of separation between two Gaussian components. $D>2$ is an indicator of marked separation between the distributions. You can use it if you have the probability distribution function or if you can model your samples with a bimodal Gaussian mixture.

$$D=\sqrt2\frac{|\mu_1-\mu_2|}{\sqrt{\sigma_1^2+\sigma_2^2}}$$

van der Eijk's A

$A$ can be used to summarize bimodality directly from the samples' histogram. $S$ is the number of categories with non-zero counts, while $K$ is the total number of categories. $U$ is a binary measure of unimodality, and is only equal to one if there's equidistribution of samples across one or more category. $A=-1$ suggests bimodality while $A=1$ indicates unimodality.

$$A = U\left(1-\frac{K-1}{S-1}\right)$$
Firebug
  • 15,262
  • 5
  • 60
  • 127
1

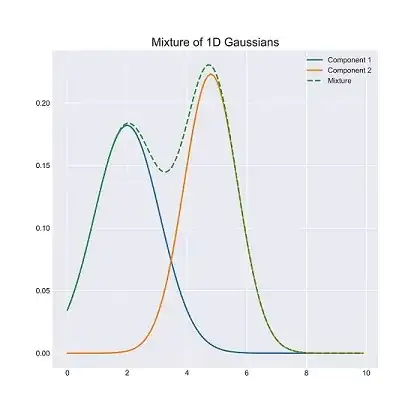
Two unsupervised learning algorithms come to mind that can help derive information of the individual components of a multimodal distribution. They isolate the individual unimodal densities within a multimodal distribution, and from there, the information and statistics of the isolated unimodal densities can be evaluated independently as you would normally do, without the parent multimodal distribution's complexity getting in the way.

Gaussian Mixture Model

GMM employs clustering in order to identify individual components (child unimodal distributions) from within the parent multimodal distribution. It does this by clustering the two components' samples distinctly from one another via expectation-maximization optimization that iteratively settles on estimates of the mean and variance for each individual component distribution. GMM works best if the components are Gaussian, but is generalized in practice to almost any bell-shaped density.

enter image description here

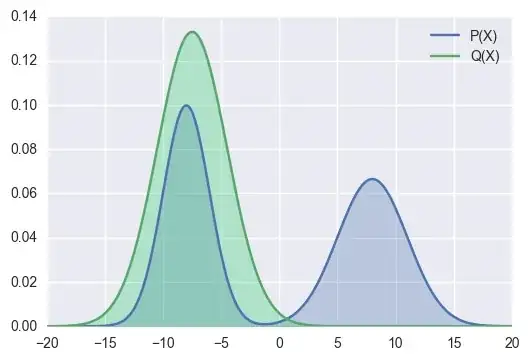
Reverse KL-divergence

This measure comes from information theory and exhibits mode-seeking behavior, whereas forward KL-divergence has difficulty detecting modes in a multimodal distribution. By fitting the reverse KL-divergence on a multimodal density, it will eventually identify one of the modes, effectively isolating that mode separately from the parent distribution, so that it can replicate that mode's density as a prediction model for individual analysis independent from the parent distribution.

enter image description here

develarist
  • 3,009
  • 8
  • 31