Linear regression line
The intention of this question seems to be that you use simple linear regression. Where you can interpret the regression line as a statistical model that describes the mean or expectation $\tilde y =E(Y|X=x)$ of the variable $Y$ conditional on the variable $X$ as a linear function that relates to the correlation and the standard deviation of $X$ and $Y$
$$\frac{\tilde y-\mu_y}{\sigma_y} = \rho \frac{x-\mu_x}{\sigma_x}$$
and filling in all the numbers $x = 15$, $\mu_x=20$, $\sigma_x = 4$, $\mu_y=25$, $\sigma_y = 6$ you can compute $\hat{y}$
$$\begin{array}{rcl} \tilde y &=& \mu_y + \rho \frac{\sigma_y}{\sigma_x} (x-\mu_x) \\ &=& 25+0.6 \frac{6}{4} (15-20) \\ &=& 20.5 \end{array}$$
However, this use of simple linear regression may be terribly wrong in answering the question
If the currency authority sets the money supply growth rate of the
next year as 15%, what would the inflation rate of the next year be?
The section below shows how it can be wrong to apply simple linear regression in this situation. The message that you should get from this answer is that 'while your homework question has good intentions by letting you compute the regression line based on simple measures such as correlation and standard deviation... you should do not do this in real life without confirming the linear model'. For instance, you should at least look at some plots first.
Quantity theory of money
The use of a regression line is a simplification of the situation. It relates to the quantity theory of money where you can use the following linear expression for rates of growth:
$$\% \Delta P = \% \Delta M + \% \Delta V - \% \Delta Q$$
where $P$ is the price level (and the change is the inflation rate), $M$ is the money supply, $V$ is the velocity of circulation, and $Q$ is the quantity of goods and services. Thus you do not have only a linear relation where $P$ is determined by $M$, but $V$ and $Q$ play a role as well (in your situation you could say that these end up in the error term, or are possibly correlated with $M$ and make the coefficient in the linear relation different from 1).
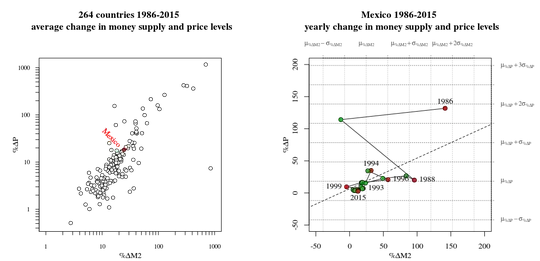
See an example of the data below for 264 countries, obtained from the world bank (inflation rate and money supply). Here we highlighted Mexico which has mean inflation rate 18, mean money supply growth rate 24.5, and correlation between the two of 0.50, which relates to the numbers in your case (the standard deviations is much larger though).
There are many things to note about the use of simple linear regression:
- The relationship is not 'exactly' linear.
- Especially for countries with low inflation the correlation between
inflation rate and money supply growth rate is much lower (thus it is
more like a curve that has smaller slope towards zero).
- If you would fit a line for the countries (left) then a few exceptional countries will dominate the relationship. If you would fit a line for the years (right) then a few exceptional years will dominate the relationship.
- Furthermore, if you look at time series for single countries then often you find much less strong linear relationships.
- The relationship is not continuous in time, and there is a strong correlation between succeeding years. Thus, you would be having much better success by predicting the inflation based on the data from the last year, rather than using a regression line for the last 30 years.

Note: In the right graph I have plotted grid lines at $\mu \pm k \sigma$. The regressionline slope $b = \rho \frac{\sigma_y}{\sigma_x}$ is always between -45 and +45 degrees with relation to these grid lines (see also regression to the mean and regression dilution). I guess that gaining intuition and understanding of this relation between regression lines, correlation and standard deviations might be the underlying purpose of the textbook/study question.
