4

I have some pairs of data ${(x_1,y_1),..., (x_n,y_n)}$ genereated by some process and would like to fit it with a function so that $y_i \approx \hat{f}(x_i)$.

By plotting the $(X,Y)$ on a 2D plot, and eyeballing, we find the relationship of data is monotonically decreasing, and the shape is similar to $y=x^{-\alpha}$ where $0<\alpha<1$.

The idea then is to use the sum of a series of basis functions to fit the data. In other words, let $\hat{f}(x)=\sum_{i=1}^m \beta_i h_i(x)$ where $h_i(x)= x^{-\alpha_i}$ for a set of predefined $\alpha$'s - ${\alpha_1, \alpha_2..., \alpha_m}$, where $0<\alpha_i<1$. We can then fit the data and find the $\beta_1,.., \beta_m$ with least squares.

My question is then is if the basis functions $h(x)=x^{-\alpha_i}$ are okay to use? Do I need to somehow make the basis function better? Is there any better ideas?
Tom Bennett
  • 677
  • 4
  • 15
  • The brevity of your post is laudable, but it raises many questions about what it means. How is the function represented? What is the purpose of approximation? How should the accuracy of the approximation be measured? How is this seemingly mathematical question related to statistics? – whuber Feb 07 '19 at 21:02
  • Since you think that the shape is similar to $x^{-\alpha},$ have you tried fitting the log-log data to a linear model and observing the goodness of fit and slope? – Bridgeburners Feb 07 '19 at 21:23
  • Would you please post a link to the data? – James Phillips Feb 07 '19 at 21:30
  • 2
    Such models are notoriously difficult to fit unless you have collected extremely accurate data at just the right values. Thus, the details of your data might matter. In particular, how do you determine $m$ and the $\alpha_i$? – whuber Feb 07 '19 at 22:01
  • Yeah, I know what you mean that such models are very difficult to fit. But I am not looking to recover the actual underlying structure of the model. I am just trying to do a prediction - as long as the fitted error is small, I don't really care about the form of the model. I will try to find some data, but such data morphs a lot from time to time and any piece won't be very representative of all the possibilities. – Tom Bennett Feb 07 '19 at 22:30
  • Would a spline work for your needs? – James Phillips Feb 08 '19 at 02:00
  • Yes, I tried a spline. The problem is that in some regions it oscillates a lot. It does not look like a monotonically decreasing curve. – Tom Bennett Feb 08 '19 at 04:31
  • Without data I am unable to suggest any candidate equations. – James Phillips Feb 08 '19 at 10:18
  • 1
    Then you could also try a monotone spline. There are examples on this site. – kjetil b halvorsen Feb 08 '19 at 10:40

1 Answers1

3

I am not sure to well understand your question. The given data is $$(x_1,y_1),...,(x_k,y_k),...,(x_n,y_n)$$ You want to approximately fit the function : $$y(x)=\sum_{i=1}^m\beta_i x^{\alpha_i}$$ that is : $$y_k\simeq\sum_{i=1}^m\beta_i x_k^{\alpha_i}+\epsilon_k$$

and you wrote " for a set of predefined $\alpha_1,\alpha_2,..,\alpha_m\:$".

This makes think that $\alpha_1,\alpha_2,..,\alpha_m$ are known (given or a-priori chosen). Is it true ?

If NOT TRUE, the $\alpha_i$ have to be optimized. The problem is not easy. They are some methods that we could eventually discuss later.

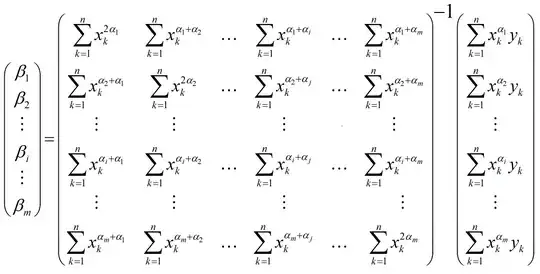
If TRUE, the solution is very easy because the regression is linear (with respect to the unknowns $\beta_i$ ) :

enter image description here

JJacquelin
  • 551
  • 3
  • 8