2

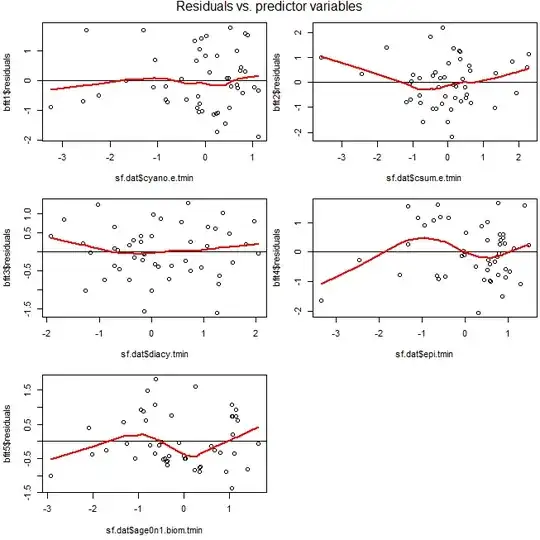
This is a follow-on question from here. I received two conflicting answers to the question posed in the title of this post. The diagnostics of the multiple regression looked okay (see link), but it was recommended there that I use individual residuals vs. predictor variables plots in order to assess the linearity of the component variables that make up the multiple regression. Here they are.

enter image description here

I believe that the two plots on the right and the bottom one are sufficiently non-linear that those data should be further transformed to increase linearity before using them. But do I have still have to do that, given that the multiple regression diagnostics were okay? I haven't found the answer in textbooks.
ginko
  • 119
  • 1
  • 6

1 Answers1

6

The other "multiple regression diagnostics" you refer to assessed other aspects of the model. Whether or not they were OK doesn't tell you whether or not this aspect of your model is OK. So, yes, you should check both.

As an aside, I would not conclude that the two plots on the right and the plot at the bottom show any problems worth addressing. Those LOWESS lines are being pulled by small numbers of isolated data. That behavior is to be expected given how LOWESS lines are fitted. I doubt those wiggles are reliable. Your functional forms look fine to me.

gung - Reinstate Monica
  • 132,789
  • 81
  • 357
  • 650
  • You did answer that question in the linked page about the other diagnostics, so thanks for your patience. Do you know of a good reference that gives guidance on how to interpret these residuals vs. predictor plots? Look for the "sky at night" pattern in the plotted points? Maybe for small data sets I could change the lowess span and that would help? – ginko Jan 19 '19 at 20:21
  • There are some questions on the site. It's pretty standard stuff. You mostly just need experience. I would suggest you spend some time getting familiar w/ LOWESS. That seems to be the issue. – gung - Reinstate Monica Jan 19 '19 at 21:27