The covariance matrix is pretty unintuitive, as you have noted. A good way to build intuition is to generate some data according to the distribution and plot it as a scatter plot. If you have access to Matlab, you can use the 'normrnd' function, other languages should have similar functionality.
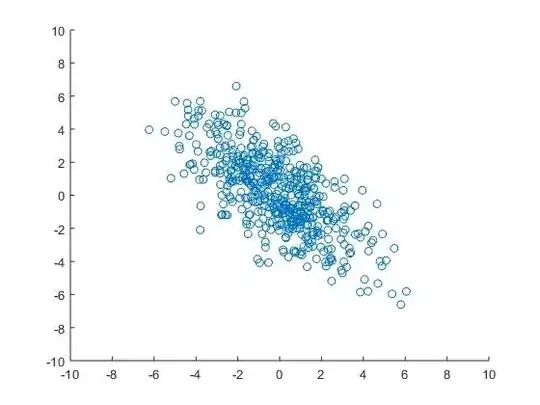
Here's my plot of 500 data points generated from your covariance (mean zero):
Now, for some math:
To answer your question, we can calculate the eigenvectors and eigenvalues of the matrix. Eigenvalues/vectors is a bit complicated and mathy, but they are much easier to intuit about than the covariance matrix itself.
The eigenvector corresponding to the largest eigenvalue points in the direction of the largest variance of the data. The eigenvector corresponding to the smallest eigenvalue points in the direction of the smallest variance. Check out this link for pictures: http://www.visiondummy.com/2014/04/geometric-interpretation-covariance-matrix/
For your data, the eigenvalues are 1.47 and 9.53 and the corresponding eigenvectors are [-0.75 -0.66] and [-0.66 0.75]. This means that the largest variance in the data can be found in the direction [-0.66 0.75], which is basically a -45 degree angle. The difference between largest and smallest eigenvalue is pretty large, so the covariance is pretty "drawn-out". This means that x and y is quite heavily correlated (large x gives small y and vice versa).
(Now I check these results against my plot: They seem to match the generated data! Nice!)
How can I interpret the matrix in order to find the variance along the horizontal axis, x and the variance along the vertical axis, y?
To this, you project the eigenvalues into the x- or y-axis. More math, once again. If you want to check your answer, you can generate data points (as I did in my graph) and calculate the variance and x and y on these data points. If you use enough data points, the answer will be very similar.
I understand that if covariance(x,y) = 0 ; then the data is decorrelated... how does this tie in with the given matrix?
The covariance of x and y is given by the value not on the diagonal of the covariance matrix. Like this:
[variance-x     covariance-xy
 covariance-xy  variance-y];
(Yes, the covariance comes twice!)
So if the value of "covariance-xy" is zero, there's no correlation. But what if it isn't zero? Then it depends on the other values of the matrix. So "covariance-xy" might be really small, but there might still be a significant correlation when you look at the data. Once again, look at the eigenvectors instead.
