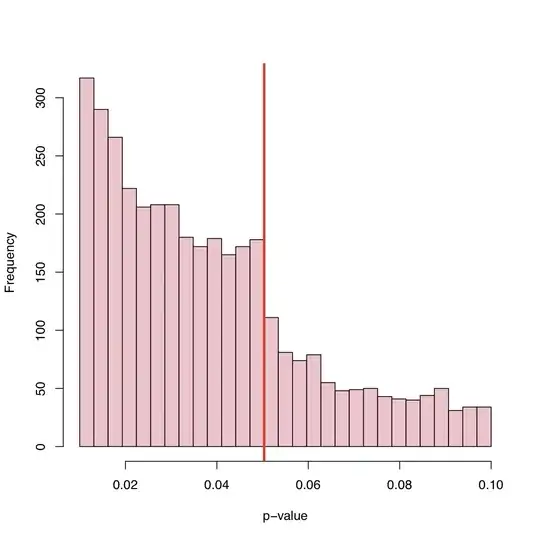
I think it is a combination of everything that has already been said. This is very interesting data and I have not thought of looking at p-value distributions like this before. If the null hypothesis is true the p-value would be uniform. But of course with published results we would not see uniformity for many reasons.
We do the study because we expect the null hypothesis to be false. So we should get significant results more often than not.
If the null hypothesis were false only half the time we would not get a uniform distribution of p-values.
File drawer problem: As mentioned we would be afraid to submit the paper when the p-value is not significant e.g. below 0.05.
Publishers will reject the paper because of non-signifcant results even though we chose to submit it.
When the results are on the borderline we will do things (maybe not with malicious intent) to get significance. (a) round down to 0.05 when the p-value is 0.053, (b) find observations that we think might be outliers and after rmoving them the p-value drops below 0.05.
I hope this summarizes everything that has been said in a reasonably understandable way.
What I think is interest is that we see p-values between 0.05 and 0.1. If publication rules were to reject anything with p-values above 0.05 then the right tail would cut off at 0.05. Did it actually cutoff at 0.10? if so maybe some authors and some journals will accept a significance level of 0.10 but nothing higher.
Since many papers include several p-values (adjusted for multiplcity or not) and the paper is accepted because the key tests were significant we might see nonsignificant p-values included on the list. This raises the question "Were all reported p-values in the paper included in the histogram?"
One additional observation is that there is a significant trend upward in the frequency of published papers as the p-value gets far below 0.05. Maybe that is an indication of authors overinterpreting the p-value thinking p<0.0001 is much more worthy of publication. I think author ignore or don't realize that the p-value depends as much on sample size as it does on the magnitude of the effect size.