0

I have a dataset associated with labels. According to https://arxiv.org/pdf/1802.03426.pdf --> UMAP (Uniform Manifold Approximation and Projection) which is a novel manifold learning technique for dimension reduction and the data, I succeeded to create the green and red clouds bellow. The problem I have is they are stick together. For machine learning purposes, it is kinda hard to learn something when the clouds are placed that way.

Cloud 1

Cloud 2

Is there a topological approach that might be used to create a significant space between clouds?

UPDATE

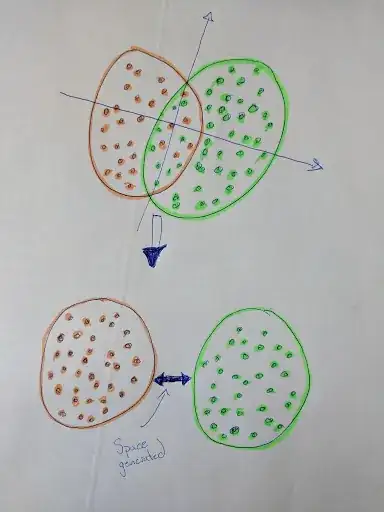
I would be interested by an analytic approach to separated the two clouds. Each cloud can be seen as a compact space.

Here is an example in 2-D. I would like a way to generalize that concept in z-D, where z would be a finite positive integer.

Clouds separated

UPDATE

I have already used several approaches to tackle my problem, i.e. PCA, t-SNE, SVM, using a neural network to classify the points. The problem is I got always two clouds but stick together. UMAP gave me the best results. Now, once UMAP has been applied, I want a way to force the clouds to be separated in knowing the clouds are already well distinct.

UPDATE 2

I am trying an approach, but I am far from certain that it's the best solution.

  1. Cover each cloud by the smallest possible sphere.
  2. Extend the intersection of the spheres by an hyperplane.
  3. Taking away the clouds according to the orthogonal vector to the hyperplane by a distance alpha.

UPDATE 3

def umap_plot(trans, label, transform=False):

    fig = plt.figure(figsize = (8,8))
    ax = fig.add_subplot(1, 1, 1, projection='3d')

    ax.set_title('UMAP - 3D representation', fontsize = 20)

    targets = [1, -1]
    colors = ['g', 'r']

    for target, color in zip(targets, colors):

        indicesToKeep = np.array([i==target for i in label])

        if target == 1 and transform == True:
            trans.embedding_[indicesToKeep] += 20

        ax.scatter(trans.embedding_[indicesToKeep][:, 0],
                   trans.embedding_[indicesToKeep][:, 1],
                   trans.embedding_[indicesToKeep][:, 2],
                   c = color,
                   s = 20)

    ax.legend(targets)
    ax.grid()

    plt.show()

from random import shuffle

listing = list(zip(trans.embedding_.tolist(), y_train))
shuffle(listing)
trans.embedding_, y_train = list(zip(*listing))
trans.embedding_, y_train = np.array(trans.embedding_), np.array(y_train)

umap_plot(trans, label)

Even shuffling the data gave me the same plot result

davegaut
  • 11
  • 3
  • If the clouds are just "nearby" eachother, then any nonlinear supervised method should work (random forest, nonlinear SVM, etc.). If the clouts *overlap*, then you're in trouble. The success/failure of a nonlinear supervised method will tell you the extent to which there is overlap. – Sycorax Dec 07 '18 at 17:12
  • I am looking for an analytics technique because I tried so many things so far, i.e. PCA, T-SNE, SVC, UMAP (worked better). I want a technique that can allow me once I apply UMAP to detach what is stuck together. – davegaut Dec 07 '18 at 17:41
  • 3
    Since you have a labelled dataset, why not just try to classify it using a nonlinear classification (SVM, Neural Network, etc.)? If these fail, then you're very unlikely to separate the two clouds. All your diagrams show is that your data is likely not separable in 3 dimensions. – Alex R. Dec 07 '18 at 19:18
  • @AlexR. It is because I want to create an algo which will be used with high-frequency speed. So the algo needs to be fast enough. I believe the "Uniform Manifold Approximation and Projection" to be tweakable so that I can preprocess the data and pass it to an LSTM. The idea are is three steps : 1- Reduce the dimensionality, separated the clouds and then pass the data to the LSTM model. – davegaut Dec 07 '18 at 19:51
  • @AlexR. Actually, UMAP gave two clouds we can well distinguish, but because because they are two closed from each other, then it makes the training difficult. So the idea is to force separating the clouds. – davegaut Dec 07 '18 at 20:12
  • 1
    @davegaut: Again, why are you using an unsupervised method to then train a supervised one? If your goal is to separate the clouds, that's equivalent to classifying the label of a point. – Alex R. Dec 07 '18 at 21:03
  • @AlexR. I have way to much features and the data is quite noisy. The problem in itself is quite hard to solve. We want to feed the models with less data and that the data have to be relevant. It is well known that if I provide less data, then it becomes easier for the model to find anomalies. – davegaut Dec 07 '18 at 21:26
  • 1
    What you’re saying makes zero sense. You were clearly able to feed your entire set of features into UMAP, an algorithm which has considerably higher complexity than most basic classifiers. Again you are implicitly assuming that an unsupervised algorithm will outperform a supervised algorithm in a classification task, which is nonsense. – Alex R. Dec 07 '18 at 21:33
  • For me it makes sense. Let me get this straight ... 1- I take the x_train and y_train that I pass to umap(...).fit_transform(...) which allows to reduce the dimensionality from 200 --> suppose 3, 2- then separate the clouds with a spectral geometry approach probably and then 3- pass the new data to a NN model. Tell me precisely what is wrong with that approach. It is equivalent to pass the data to an autoencoder and pass to a NN for a supervised learning phase. – davegaut Dec 07 '18 at 21:42
  • @AlexR. Forcing to separate the clouds is just a way to force the model to learn something. It's the equivalent of saying ... If you do not want to eat your vegetables, then I'll kindly force it into the throat. – davegaut Dec 07 '18 at 21:51
  • 2
    But why are you against trying a supervised approach? If you use say, a neural network to classify your points, then you can extract an embedding of your points by querying the layer just before classification. This will *always* do a better job than an unsupervised method, since the network is rewarded for separating different class labels as opposed to just relying to vague measures of distance between points. – Alex R. Dec 07 '18 at 23:34
  • @AlexR. It's been 8 months I am working on that problem. Trust me, I tried every methods you proposed me. I have already tried using a NN to classify the points. The next step is really to force separating the clouds. Would you like to work few hours with me on that project? Maybe you would help. – davegaut Dec 08 '18 at 00:00
  • 2
    Start by at least posting a sample of a few rows of your data. People have very different definitions of "way too many features." – Alex R. Dec 08 '18 at 01:15
  • Posting a .pkl file for one day on google drive? I can make it public. Or a simple sample? Actually the shape for one day training is (23335, 45, 80). So for each second, a label is associated with a matrix (45, 80) where 80 is the number of features and 45 is the number of seconds I am looking in the past. So at each second, I am providing 45*80 = 3600 data to the model. And no, it is not pictures. – davegaut Dec 08 '18 at 01:27
  • 1
    Are you sure that the apparent separation of red and green isn't an artifact of the way that you plotted the data? If the data is sorted by red and green, plotting libraries will sometimes plot the data in order, so you can get plots that *appear* to show that the two are distinct when in fact one is right atop the other and there's no distinction between them. Shuffling the data and plotting the points with some transparency can help this. – Sycorax Dec 10 '18 at 16:09
  • @Sycorax I updated the question – davegaut Dec 10 '18 at 20:52

0 Answers0