4

I have an image that has artefacts which I am using a specific process to remove. I want to show that the new image is improved by that process. To compare the two images I am using data from a specific row of the image.

This would be the data (intensity of one specific row) before the change:

y1=[118 117 118 120 80 117 118 120 118 119 121 119 121 118 121 120 118 80 120 121]

and the data after the process:

y2=[118 117 118 120 118 117 118 120 118 119 121 119 121 118 121 120 118 119 120 121]

The above data are not all the data (there are tens of thousands of data points, this is just an example). I know that there are ways to show that the two datasets are different but what I want to show is that the second dataset is now more smooth, therefore the new image has been improved.

Is anyone aware of such a metric?

Karolis Koncevičius
  • 4,282
  • 7
  • 30
  • 47
AL B
  • 227
  • 3
  • 12
  • 1
    What about variance? – Tim Nov 30 '18 at 18:55
  • @Tim, a sloped line can have high variance – Aksakal Nov 30 '18 at 21:35
  • @Aksakal I'm trying to understand what OP defines as smoothness, for me the two examples seem to differ in variance, so I'm wondering if low variance is meant by smoothness in here. – Tim Nov 30 '18 at 21:39
  • @Tim, right, OP didnt define his smoothness. I thought in the context of images a gradient change in intensity should be considered smooth, while a checkered image should be rough. Hence, my answer. – Aksakal Nov 30 '18 at 21:51
  • Some related questions and their answers: [Measuring the smoothness of a time series](https://stats.stackexchange.com/questions/71455/measuring-the-smoothness-of-time-series) https://stats.stackexchange.com/questions/71455/measuring-the-smoothness-of-time-series [How to measure smoothness of a time series with R](https://stats.stackexchange.com/questions/24607/how-to-measure-smoothness-of-a-time-series-in-r) – GiorgioG Dec 01 '18 at 09:30
  • Sorry about not defining things better. The way i would define that an image is smoother than another is for instance when it is lacking artifacts. This is the case in my example. I have removed some artifacts from my image and i want to show quantitative that the image now is smoother than before, so it has improved. The data are just pixel intensity in one specific row. – AL B Dec 05 '18 at 16:44

4 Answers4

4

The conventional smoothness measures are based on derivatives, and are sometimes called "roughness." For instance, in smoothing splines there's a roughness penalty, which you minimize to get the smooth curve. In case of splines you want continuous first derivative, therefore, the roughness is based on the integral of the square of the second derivative: $$\int [f''(x)]^2dx $$

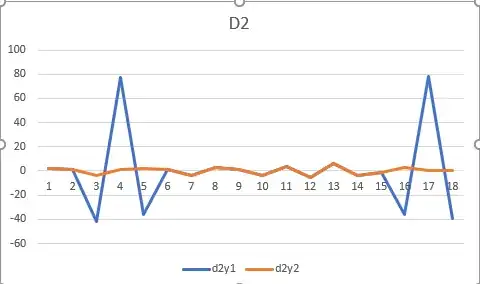
In your case, you could use the second difference which corresponds to the second derivative: $$D2=\sum_i [x_i-2x_{i-1}+x_{i-2}]^2/4$$

Demo

Here's the demo on your data set. For your two series this measure D2 is: enter image description here

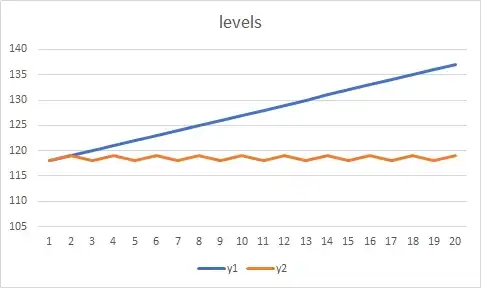
The levels plot:

enter image description here

Here's the second difference plot:

enter image description here

We see the first row is much rougher.

Why not D1?

Let's see why for smoothness (roughness) the second derivative is generally more appropriate.

Consider these two series:

enter image description here

enter image description here

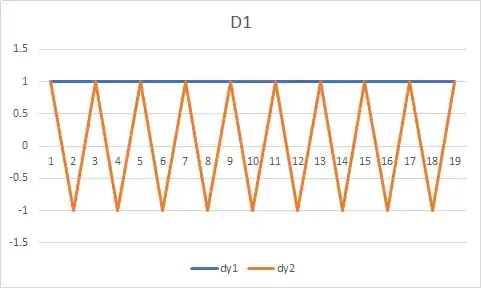
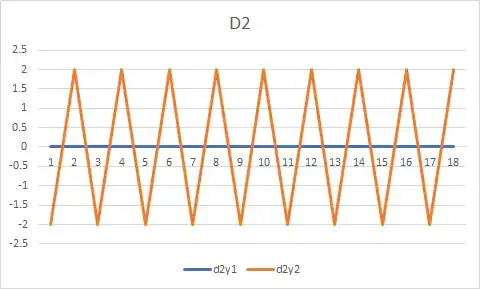
The sums of squares of first differences are the same: 18 The sums of squares of second differences are: 0 and 72, which represents the intuitive and visible roughness very well.

Here's the plot of first difference:

enter image description here

And here's the plot of the second difference: enter image description here

Conclusion

You can go for higher differences, e.g. third difference, but going after the first difference is not helpful to measure the smoothness. The reason is that our intuitive understanding of smoothness is compatible with any first derivative! Any series with a trend will have the first derivative, and it's not an rough series necessarily. The series are rough when the first derivative starts jumping around, which is when the higher derivatives are high.

Aksakal
  • 55,939
  • 5
  • 90
  • 176
  • I took second differences and it didn't appear to make the data as smooth as I would have liked ...yielding 18 values. – IrishStat Nov 30 '18 at 20:47
  • @IrishStat, frankly, I don't think I understand your comment – Aksakal Nov 30 '18 at 21:34
  • I understood ( perhaps mistakingly ) from your initial comment that your approach would be to smooth by taking second differences. Sorry I took second differences of Y while you did something totally different in your revised comment/answer. – IrishStat Nov 30 '18 at 21:39
  • 1
    @IrishStat, I'm suggesting to simply use the roughness penalty, that is used for smoothing. The actual smoothing is unnecessary to measure the roughness – Aksakal Nov 30 '18 at 21:48
  • I will do this calculation, maybe since i have a bigger sample it will work better for me. Thank you. – AL B Dec 05 '18 at 16:48
2

If this is an image then in my understanding a row should display a gradual change between the adjacent pixels. In such a case autocorrelation (the correlation of data with itself after a shift by one pixel) should work as a measure of smoothness.

However using your example I only get a slight increase in autocorrelation. Using R:

y1 <- c(118, 117, 118, 120, 80, 117, 118, 120, 118, 119, 121, 119, 121, 118, 121, 120, 118, 80, 120, 121)
y2 <- c(118, 117, 118, 120, 118, 117, 118, 120, 118, 119, 121, 119, 121, 118, 121, 120, 118, 119, 120, 121)

acf(y1, plot=FALSE, lag.max=1)

# Autocorrelations of series ‘y1’, by lag

     0      1
 1.000 -0.095

acf(y2, plot=FALSE, lag.max=1)

# Autocorrelations of series ‘y2’, by lag

    0     1
1.000 0.086

This might happen if there is not much going on in the row you selected. i.e. it only has shades of the same color. Or if the drawing on the picture has very thin edges so that the contours of an object are only one pixel in width. In this case shifting the row by one pixel would dislocate the edges.

Karolis Koncevičius
  • 4,282
  • 7
  • 30
  • 47
  • I will check the number i get, since i have tens of thousands of rows, but this looks like a pretty straight forward calculation. Thank you! – AL B Dec 05 '18 at 16:47
  • I did some reading about the autocorrelation and I think it is what i am looking for. I am not familiar with R, I am using Matlab, can you explain to me what these numbers are in your results (0 1 1 -0.095), so i can calculate it in Matlab? – AL B Dec 08 '18 at 20:21
  • @ALB yes certainly. auto-correlation is measured by "lagging" the sequence and then correlating it with the original one. You lag a sequence by shifting it to the left or to the right by a certain amount. The numbers there are lags (0 1) - meaning the sequence were not shifted at all (0) or shifted by one position (1). The other numbers below them (1.000 and -0.095) are the correlations obtained for the lag of (0) and the lag of (1) respectively. Hope this helps! – Karolis Koncevičius Dec 08 '18 at 21:55
  • 1
    Thank you, this helped a lot. I was able to graph the auto correlation for the before and after image row and showed that there was a 'bump' where the artifacts were removed that the new processed image does not have. – AL B Dec 08 '18 at 23:36
1

One way to measure non-smoothness is to first smooth the data, subtract it away and compute some measure of how much residuals do you have (i.e. sum squares of all residuals). I.e. you can apply a Laplacian filter and compute the sum of squares of the residuals for both images and compare.

sega_sai
  • 670
  • 7
  • 12
  • Interesting. I had done something similar but with a Gaussian blur for the image and it showed almost no change. I think the reason for that is because my images are huge compared to the artifacts so any change does not register in the data. Thank you for the suggestion. – AL B Dec 05 '18 at 16:50
1

I totally agree with @Tim's comment about variance but I felt motivated to go a step further, as is my want. I took the 20 values enter image description here and mused as to what AUTOBOX would do with these values essentially revisiting this post How to calculate the standard average of a set excluding outliers? .

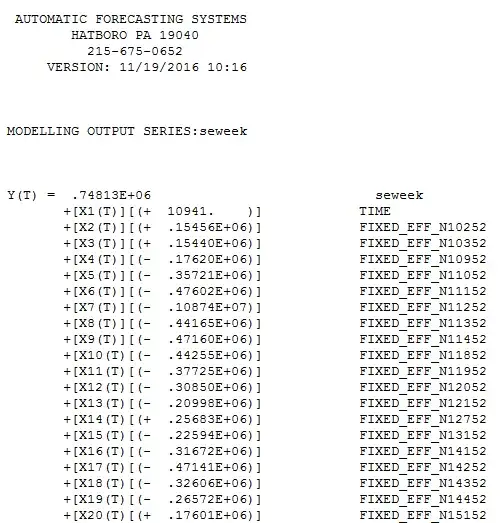
AUTOBOX delivered the following adjustments to cleanse the data using procedures developed here http://docplayer.net/12080848-Outliers-level-shifts-and-variance-changes-in-time-series.html . Additionally identifying an unusual value at period 4 and a persistant level/step shift starting at period 8.

enter image description here

The plot of the Actual and Cleansed Data is educational as to what the human eye sees and what it doesn't see .enter image description here.

What we miss initially is the subtle but significant anomaly at period 4 and the persistent level shift at period 8 BECAUSE we are focused on the overwhelming pulse impacts at periods 5 and 18.

Going one step further ( always dangerous with small samples but not necessarily so when there is strong signal ) the model's residuals suggest a constant/persistant blurring (inncreased error variance ) from period 7 to 20enter image description here

The question I really answered "Is there a better process ?" in terms of making data smoother ? i.e. less effected by blurring . Or is it possible to further reduce the variance (non-systematic behavior )?

IrishStat
  • 27,906
  • 5
  • 29
  • 55