1

Our organisation is currently putting together a report based on a salary survey of employees within a specific industry (a huge array of questions with varying types of answer). We surveyed 11,000 people, and there are 400,000 people nationwide within this industry.

We're now putting the report together and want to include margin of error in our statistics. I've been charged with doing this, and while I'm mostly confident in super-basic statistical analysis, I just want to check that I'm doing things right.

As someone who isn't particularly well versed in this side of stats, I defaulted to some online calculators. The first one that came up was from SurveyMonkey, and while I wasn't expecting that to be particularly scientific (just scientific enough), but I was a bit confused by the method. The user-fillable boxes asked me for sample size + population size and the confidence interval I wished to calculate at (95%), and returned a 1% margin of error.

However, below it explains what the formula to calculate margin of error is, and this is where I got lost:

$$z\times\frac{\sigma}{\sqrt{n}}$$

where $n$ = sample size, $σ$ = population standard deviation, and $z$ = z-score.

I hadn't entered standard deviation in the initial box (which is difficult to nail down in our survey due to the varied nature of it, with lots of plain text answers). When I used the standard deviation of salaries (I chose this as it's the key variable in the report, came out as 7) in the above equation, I ended up with a very different margin of error. I tried to do some reading around this and it seems there are couple of different methods to get to margin of error (something that often seems to be completely misinterpreted as a statistic, which must be endlessly frustrating!) but I'll admit that I struggled to get my head around them.

Apologies for the long winded explanation of something that is probably very elementary, but I guess my questions are:

  • Is there a way to calculate margin of error if you only have sample size/population size?
  • How did SurveyMonkey arrive at the 1% figure?
  • Is there a simple way to calculate standard deviation here that I've completely overlooked?

If it helps, tools-wise I'm using Excel and general internet advice for everything.

Thanks in advance – I feel like there is probably a very simple answer to this problem that is eluding me.
Alexis
  • 26,219
  • 5
  • 78
  • 131
btphawk
  • 11
  • 1
  • 2
    I got to the end of your post without knowing *what* you want to compute the margin of error of. At one point it seemed to be related to some text answers and at another point, to the salaries. Survey Monkey is concerned about proportions of yes or no responses, which is a third possibility. What are you actually trying to report? – whuber Nov 28 '18 at 23:59
  • Sorry! I think this is partially the gap that I'm trying to fill. I think it's most sensible to use salary as it's the most important variable we looked at (and the easiest to quantify) but that also gave me a wildly different result, which is a lot of what I'm asking about. Apologies again, new to all this! – btphawk Nov 29 '18 at 01:05

1 Answers1

3

Here are some comments. Other than mentioning 'salaries', you have not given much information about what kind of information you collected in your survey. And you said nothing about the purpose of stating margin of error.

In statistics a common use of the terminology 'margin of error' has to to with confidence intervals. A common type of 95% confidence interval is of the form $\bar X \pm 1.96 S/\sqrt{n},$ where $\bar X$ is the mean of the sample, $S$ is the standard deviation of the sample, and $n$ is the sample size. The number 1.96 is used because the interval $(-1.96, 1.96)$ contains 95% of the probability in a standard normal distribution (or, for very large sample sizes, also in the relevant t distribution).

This kind of confidence interval is made in such a way that it should contain the unknown population mean $\mu$ in 95% of the cases where it is used.

If your data are not extremely skewed toward high values (with extremely high values much more often than extremely low values), then this is a useful and often used kind of confidence interval. The quantity $1.96S/\sqrt{n}$ is called the 95% margin of error of such a confidence interval. I doubt that the readers of your report will be trying to estimate population means, but this is a very common use of the term margin of error and it might be good enough for your purposes to give the sample mean and the 95% margin of error.

If your data are highly skewed (and salaries are often skewed), of if you are reporting opinions on job satisfaction (perhaps on a scale from 'very unsatisfied' to 'very satisfied"), then this kind of margin of of error might not be so useful. Then you could give an idea of the variability of the data by giving the population median and the lower and upper quartiles ($Q_1$ and $Q_3,$ respectively). That way readers of the report will know that 50% of the people surveyed gave answers below (and above) the median and that the interval from $Q_1$ to $Q_3$ contains the middle half of the responses (sorted in order). [You might also use lower or upper deciles to give an interval that contains 80% of the responses.]

Note: You should not give the maximum or minimum values, because you have probably promised not to reveal individual information. And if your survey contained a famous industry leader, giving the maximum salary could reveal the reported salary of such a person.

There are other possibilities, but I have seen both the 95% margin of error and median-quartiles methods used to report variability in industry surveys. If you can tell us more about your data and objectives, maybe one of us can give you more specifically targeted suggestions.


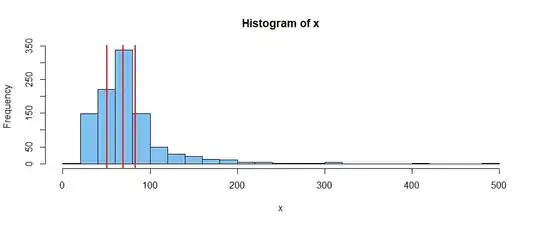
Example: Below is a histogram of 1000 right-skewed salaries in thousands of dollars (simulated, but roughly modeled after real data) with $\bar X \approx 75$ and $S/\sqrt{n} \approx 50.$ (For a larger sample from a similar population, the margin of error would typically be smaller.) Vertical red lines are at $Q_1,$ Median, and $Q_3,$ respectively.

enter image description here

BruceET
  • 47,896
  • 2
  • 28
  • 76
  • [Should the mean be used when data are skewed?](https://stats.stackexchange.com/questions/96371/should-the-mean-be-used-when-data-are-skewed) – Alexis Jan 02 '20 at 00:52