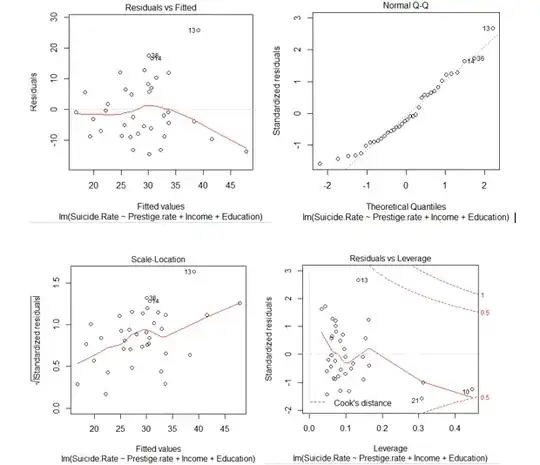
I have the following diagnostic plot for my data. Is normality violated? PLease suggest, what kid transformation I need here ?
- 7
- 2
-
1Related: https://stats.stackexchange.com/questions/61217/transforming-variables-for-multiple-regression-in-r?rq=1 – SecretAgentMan Nov 19 '18 at 23:55
1 Answers
It is not possible to tell you how to change your model solely from the information in your diagnostic plots. However, I notice from your axis labels that your response variable is a rate variable (i.e., a ratio of counts of occurrences of an event over cases). Variables of this kind are usually not well-modelled by a standard linear regression, since we expect the rate metric to be less variable as we increase the cases used in the metric. Regression analysis with a rate variable usually leads to problems of heteroskedasticity, which is evident in your scale-location plot.
Regression analysis using a rate variable as the response variable is often well-modelled by using a negative binomial GLM on the original count values for the event of interest (suicides), using a logarithmic link function with a fixed offset term for the case denominator in the rate metric. (An example of this kind of analysis is shown in this related answer.) This is where I would start if I were trying to model this kind of data. A model of this kind will have a better chance of dealing with the heteroskedasticity issue in your data, and is a good starting point for regression on a rate variable.
- 91,027
- 3
- 150
- 376