1

I am working on a machine learning project when I realized I add a question. This is not programming, nor statistic, nor a probability question, but a real pure mathematical question. So I think my question deserves a place on this site.

EXPLANATION :

My current project is a time series forecasting problem which has as purpose working on the price movement. Actually, the prediction are correct and I think we are still having some place for improvements. To deal with that question, we work with Deep Neural Network. Particularly, it is a regression problem where we use LSTM (i.e. a type of neural network). So we need features and a target. For some good reasons, we don't want to work on the price directly as target, but on the log-return instead, i.e. $\log(\frac{P_t}{P_{t-1}})$ where $P_t$, $P_{t-1}$ are two consecutive prices.

enter image description here

For good reasons, we decided to apply the log-return on the price as well as on the features. For the sake of that question, let's define $\log(\frac{F_t}{F_{t-1}})$ where $F_t$, $F_{t-1}$ are two consecutive features.

As there's quite a lot of stability in the features and the price, then the model tends to predict something near zero. Therefore, I would like quietly to remove useless, irrelevant data. Let me describe my needs ...

Suppose a set of consecutive times $\{t_1, t_2, ..., t_n\}$ where the log-returns $LR_{t_1} = LR_{t_2} = ... = LR_{t_n} = 0$. Also, for each time $t_i$, for $i \in \{1, ..., n\}$, lets define the set of normalized (i.e. each features has a value between 0 and 1) features $\{F^i_1, ..., F^i_m\}$.

Now lets consider the following matrix of normalized features for the predefined times $\{t_1, t_2, ..., t_n\}$

$\quad \begin{pmatrix} F^1_1 & F^2_1 & \ldots & F^i_1 & F^j_1 & \ldots & F^n_1 \\ F^1_2 & F^2_2 & \ldots & F^i_2 & F^j_2 & \ldots & F^n_2 \\ \vdots & \vdots & \ldots & \vdots & \vdots & \ldots & \vdots \\ F^1_m & F^2_m & \ldots & F^i_m & F^j_m & \ldots & F^n_m \\ \end{pmatrix} \quad$

As $F^i$ and $F^j$ are consecutive, if it is trivial that if we have $F^i = \{F^i_1, ..., F^i_m\} = \{F^j_1, ..., F^j_m\} = F^j$, then we can remove without loss of generality the $P_{t_i}$ and the associated features $\{F^i_1, ..., F^i_m\}$.

Now, I would like to extend removing prices and the associated features when we have similarities in the features. I have thought using the entropy or the mean square error (MSE) to define a measure of similarity, but it is at this point a need a bit of help.

A try : If I use MSE, we can predefined an $\epsilon$ so that if $\mid F^i - F^j \mid \leq \epsilon$, then we remove the price and the associated features for time $t_i$. Another idea would be to work with the standard deviation on a confidence interval.

QUESTION :

I am curious to find a method to measure the similarity in the features for two or more consecutive times. Any Idea? If my method is great (I doubt!!), how can I set the right $\epsilon$?

UPDATE

Why did I decided to use the log-returns and not prices to model financial data in time series analysis?

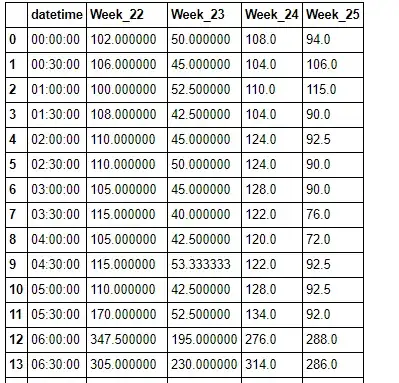
Basically, prices usually have a unit root, while returns can be assumed to be stationary. This is also called order of integration, a unit root means integrated of order $1$, $I(1)$, while stationary is order $0$, $I(0)$. Time series that are stationary have a lot of convenient properties for analysis. When a time series is non-stationary, then that means the moments will change over time. For instance, for prices, the mean and variance would both depend on the previous period's price. Taking the percent change (or log difference), more often than not, removes this effect.
Why non-stationary data cannot be analyzed?

user1050421
  • 81
  • 2
  • 9
  • 1
    I do not know about LSTM, but I do know that fitting a model to the derivative of your signal is often much more difficult because the effects of noise may blow up. That is: the signal to noise ratio may increase a lot, since the operation of taking the derivative may greatly reduce the signal if the slope is small (the fact that you use the logarithm, which relates to smaller slopes/changes, makes this worse). – Sextus Empiricus Nov 18 '18 at 13:17
  • Are you up to make a full answer with details? – user1050421 Nov 19 '18 at 02:12
  • I know nothing about LSTM and how it models a function so I can not easily give an example relating to that. To help other people that may potentially answer your question you might possibly want to explain some more about the nature of your signal and those 'good reasons' that make you prefer to relate $\log(P_t)-\log(P_{t-1})$ with $\log(F_t)-\log(F_{t-1})$ instead of more directly $\log(P_t)$ with $\log(F_t)$ I know for physics problems the relation may become more simple, e.g. linear, but I guess for LSTM (non-parametric?) that difficulty of the true expression/function would not matter. – Sextus Empiricus Nov 19 '18 at 07:12
  • Related to this https://stats.stackexchange.com/questions/352036/what-should-i-do-when-my-neural-network-doesnt-learn ? Or how is it different? – Sextus Empiricus Nov 19 '18 at 08:58
  • @MartijnWeterings I modified my question – user1050421 Nov 19 '18 at 14:44
  • I am with a physics background and not with an economics background. For me, your edit mostly adds a lot of unclear terminology, and is not explaining your reasons. You would be able to reach a much wider public on the statistics website if you could undo your question from the details that are specific to econometrics. – Sextus Empiricus Nov 19 '18 at 14:57
  • Aside from my comment on the signal to noise ratio (which was a bit of-topic) I wonder why you consider adjusting the data table (instead of considering a different loss function) in order to solve the problem *"the model tends to predict something near zero."*. And what makes you believe something is *"irrelevant data."*? The answer to *"a method to measure the similarity in the features"* is very broad. It can be answered with more information about the actual hypothesis on the relationship or behavior of the features and prices (which is more economics than statistics). – Sextus Empiricus Nov 19 '18 at 15:02
  • 1) Is it true (as stated) that the *prices* are zero at times, not the returns? 2) Why do you think that no (change of) price is irrelevant, useless data? If your time series shows periods with low and high price volatility this would seem highly relevant to me. Maybe you are not sampling at the right frequency? 3) If you remove points from your time series, how do you want to deal with the fact that the remaining points are sampled at irregular intervals? – g g Nov 20 '18 at 11:27
  • @gg You are right. It is not the prices which is equal to zero, but the log-returns instead. There is a lot a variance in the price, but because the price is sometime stable, which is perfectly normal, then there is a lot of zeros in the data. – user1050421 Nov 20 '18 at 12:12

1 Answers1

1

I think that your problem is not really about stability, I will try to formulate an answer in 3 steps.

First, How to measure similarity between features ?

This is a full area of research and there is no way to find an absolute answer. Similarity is most commonly measured using RMSE indeed but you can find a lot of different functions that will measure the distance between 2 vectors. Finding the right similarity function is mainly linked to the question "what is your objective?" which brings me to the second point.

Second, Your objective is not clearly defined.

Why do you want your algo to predict less 0s ? You need a clear metric to evaluate your full process, data cleaning/selection, feature engineering and training. From what I understand you haven't defined any metric but you don't fully like the RMSE that your RNN is trying to minimize. Yet it is giving you the best possible outcome, and this outcome includes a lot of 0s...

Moreover when you train your RNN, it minimizes a Loss. By removing some points you are affecting your loss. Exemple: If you had 2 points with similar features and price, it means that the weight of that combinaison would be 2 compare to a point (feature, price) that would be alone. Now you are removing that point, making its weight back to one. This is a problem because if your train set and test set look alike and both represent reality, you do want this point to appear twice. Each mistake on this point will cost you double once your algo will be used.

In your case, I understand that this is not important for you, so you need to define a metric that will take that non-importance into account. This metric should be directly derived from your application and include your intuition that too many prediction around 0 is bad (for some business knowledge that you have). Here is a very basic example of metric to illustrate my words:

$ MSE_+ = \frac{1}{N} \sum_{i} (\hat y_i - y_i)^2*(y_i>0)$

with $y_i$ being the true value, $\hat y_i$ the predicted value. This metric will only care to predict well if there is a change in price, which correspond to $y_i>0$.

Third, Solutions you can explore.

Once you have defined that metric you will able to optimize your problem, from the data point selection to the training. You mainly have 3 options:

  • Weighting strategies. You can weight each samples in your loss function so that the mistake on some points count less than on others. You set up different weighting strategies and you train your RNN. Then you evaluate on a separate data set each strategies according to your new metric, and you pick the best. So your RNN is not directly optimizing your metric but this process of weighting and cross-validation will do it.

  • Customize your loss function. If your metric has certain properties you will be able to easily implement the Loss function and derive the gradient. Then the gradient descent taking place during the training of your RNN will directly optimize your metric.

  • Go on with your strategy (which is most likely the same as weighting with some weights equal to 0). In that case you will have to define multiple similarity functions as well some $\epsilon$ values and cross validate to find the best combinaison.

I hope this will help you move forward.

Romain
  • 1,471
  • 9
  • 9