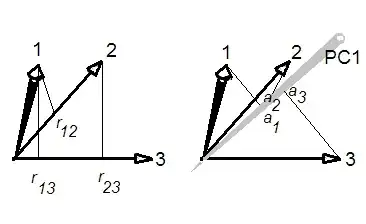
What I think happened here is that all variables were positively correlated with each other. In this case the 1st PC quite often turns out to be very close to the average of all the variables. If all variables are positively correlated with exactly the same correlation coefficient $c$, then the 1st PC is exactly proportional to the average of all the variables, as I explain here: Can averaging all the variables be seen as a crude form of PCA?
In this simple case one can actually mathematically derive the relationship you are asking about. Consider correlation matrix of $n\times n$ size that looks like that: $$\left(\begin{array}{}1&c&c&c\\c&1&c&c\\c&c&1&c\\c&c&c&1\end{array} \right).$$ Its first eigenvector is equal to $(1,1,1,1)^\top/\sqrt{n}$, which corresponds to the [scaled] average of all the variables. Its eigenvalue is $\lambda_1=1+(n-1)c$. The sum of all eigenvalues if of course given by the sum of all diagonal elements, i.e. $\sum \lambda_i=n$. So the proportion of explained variance by the first PC is equal to $$R^2=\frac{1}{n}+\frac{n-1}{n}c \approx c.$$
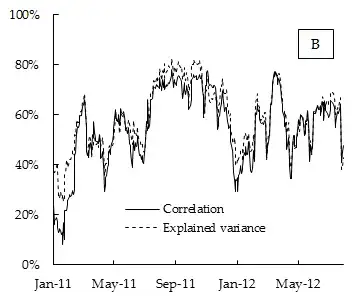
So in this most simple case the proportion of explained variance by the first PC is 100% correlated with the average correlation, and for large $n$ is approximately equal to it. Which is precisely what we see on your plot.
I expect that for large matrices, this result will approximately hold even if the correlations are not exactly identical.
Update. Using the figure posted in the question, one can even try to estimate the $n$ by noticing that $n=(1-c)/(R^2-c)$. If we take $c=0.5$ and $R^2-c=0.02$, then we get $n=25$. The OP said that the data was a "DAX stock index"; googling it, we see that it apparently consists of $30$ variables. Not a bad match.