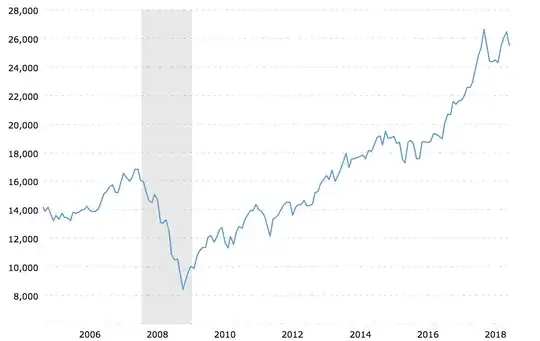
Data: I have a time series data of 2528 daily observations for OMXS.30 (Stokholm) closing price. The aim is to fit proper ARCH/GARCH models and use for forecast daily Value at Risk. Here is a plot of my data, and the daily log returns.
By looking at the log returns, can I assume the mean is stationary? (I've seen others do that but I'm not sure it's a valid assumption.)
My question is, what do I do if my data is non-stationary? Is it supposed to be? If I've understood it correctly the time series is non-stationary if the ACF decreases just as it does in the (series data) plot below. Also , the number of significant lags in the ACF of logreturns are many. What does that mean and how do I continue from this point?
As you've probably understood I am VERY new to all topics of this project, and I've never dealt with time series before. Any help would be very appreciated!


