5

I am trying to get prediction intervals around a sampled count variable.

For example, say I want to know the number of letters an apartment building receives every day. Each day I record the count from ten different apartments in the building, out of 100 total apartments, and get for example (toy data) [0, 5, 2, 0, 0, 1, 4, ...], which would represent seven days worth of total letters for those ten apartments. I can collect this over many days. (Note: I realize mail isn't delivered on Sundays, etc, but for now let's just assume it's all the same.) Let's assume this data comes from a Poisson distribution. I know I can get lambda from the data (just take mean). What I'm not sure of is how to calculate those prediction intervals for the full building. In my example, I have sampled only 10% of the building. Do I just multiply the limits of my intervals by 10? I suspect no, but I'm not sure where to make the change.

I want to be able to say, for example, "on this day, 9 letters were delivered to my sample apartments, so I think x many letters were delivered to the whole building, and my 95% prediction interval is (x-y, x+y)". Where my guess is x = 90, but I'm not sure how to get y.

Note: this originally asked about confidence intervals but I was advised to change it being that that isn't really what I was asking.
kjetil b halvorsen
  • 63,378
  • 26
  • 142
  • 467
lilyrobin
  • 51
  • 2
  • What parameter exactly do you want confidence intervals for? The mean, the total, or perhaps something else? – whuber Oct 01 '18 at 16:57
  • I want to be able to say, for example, "on this day, 9 letters were delivered to my sample apartments, so I think x many letters were delivered to the whole building, and my 95% confidence interval is (x-y, x+y)". Where my guess is x = 90, but I'm not sure how to get y. – lilyrobin Oct 01 '18 at 17:59
  • That is a description of a (Poisson) *prediction interval.* It is not a confidence interval. Please clarify your post accordingly, lest readers answer with confidence interval formulas (which will be incorrect). – whuber Oct 01 '18 at 18:03
  • I have been searching the Web for "Poisson prediction interval." The first useful hit I investigated (after following many dead ends) is a post I wrote just last year and had totally forgotten :-). See https://stats.stackexchange.com/questions/260775. I also found a nice example of one wrong way to go about this: https://stats.stackexchange.com/questions/92443. – whuber Oct 01 '18 at 18:18
  • Thanks! I'm reading your post and still not exactly sure how to translate it to my case, but I'll keep trying. – lilyrobin Oct 01 '18 at 19:03
  • 1
    The application is this: you have *no* predictors (simple!) and based on what you observe in the sample apartments you will compute a prediction interval for the total *in all other apartments.* Add the number in your sample (which, once it is observed, is a constant) to the endpoints of that interval to obtain an interval for the overall total. – whuber Oct 01 '18 at 19:20

1 Answers1

1

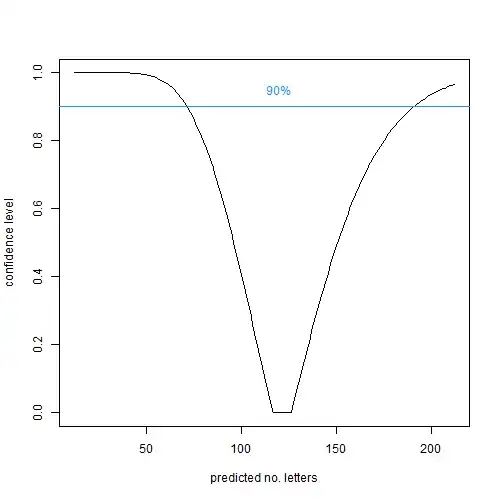
If each sampled apartment receives letters at a daily rate $\lambda$, then for $n$ apartments over $t$ days $$\sum_{j=1}^{n_X} \sum_{i=1}^{t_X} X_{ij} = S_X \sim\mathsf{Pois}\left({n_X t_X\lambda}\right)$$ where $X_{ij}$ is the no. letters received on the $i$th day by the $j$th apartment sampled. Let $Y_{ij}$ be the no. letters received on the $i$th day by the jth unsampled apartment, & suppose for the moment that the daily rate might differ by a factor $\theta$, so that: $$\sum_{j=1}^{n_Y} \sum_{i=1}^{t_X} Y_{ij} = S_Y \sim\mathsf{Pois}\left(n_Y t_Y\theta\lambda\right)$$ Considering the joint distribution of $S_X$ & $S_Y$, if you can find an $\alpha$-level test for $H_0: \theta=1$ vs $H_1: \theta\neq1$, you can invert it to give a set of $(S_X, S_Y)$ pairs for which the null is not rejected; & given $S_X=s_X$, a $1-\alpha$ prediction interval for $S_Y + s_X$. The test needs to not depend on the unknown common rate under the null, $\lambda$, which can be achieved by conditioning on the sufficient statistic for $\lambda$, $S_X+S_Y$: $$S_Y|S_X=s_X \sim \mathsf{Binom}\left(S_X + S_Y, \frac{n_Y t_Y}{n_X t_X + n_Y t_Y}\right)$$

Here is an illustration in R (I've used the equal-tailed test but you can substitute any exact two-sided test):

no.letters.sampled <- 12
no.apts.sampled <- 10
period.sampled <- 7
no.apts.unsampled <- 90
period.unsampled <- 7

no.letters.unsampled <- 0:200 # may need to widen search

calc.p.value <- Vectorize(function(s_X, n_X, t_X, s_Y, n_Y, t_Y){
  pi0 <- n_Y * t_Y / (n_X * t_X + n_Y *t_Y)
  min(1, 2*min(
    pbinom(s_Y-1, s_X + s_Y, pi0, lower.tail = FALSE),
    pbinom(s_Y, s_X + s_Y, pi0, lower.tail = TRUE)
  ))
})

p.value <- calc.p.value(
  no.letters.sampled, no.apts.sampled, period.sampled,
  no.letters.unsampled, no.apts.unsampled, period.unsampled
)

confidence.level <- 0.90
conf.region <- (no.letters.unsampled + no.letters.sampled)[p.value > 1 - confidence.level]
(conf.interval <- c(min(conf.region), max(conf.region)))
# returns a 95% C.I. of (72, 190)
plot(
  no.letters.unsampled + no.letters.sampled, 1-p.value, type="l",# lty=2,
  xlab="predicted no. letters", ylab="confidence level"
)
abline(h=confidence.level, col="dodgerblue")
text(120, 0.95, "90%", col="dodgerblue")

confidence curve

Scortchi - Reinstate Monica
  • 27,560
  • 8
  • 81
  • 248