I have 118 microbes that I have tested at various concentrations of a drug that is supposed to kill them (0.1875 - 15). However, these microbes have mutations (A-H) which confer resistance to the drug and thus allow them to survive.
I would like to group these mutations into two clusters:
- Mutations that confer high resistance
- Mutations that confer low resistance
After doing some reading, I think that Expectation-Maximization is the right clustering methodology but I have two problems:
- The data are counts (e.g., how many bugs survived at that concentration)
- I need to group by the mutation
A simplified look at my data (e.g., for one drug) looks like the following (where A-H are the mutations):
A <- c(0,0,0,0,0,0,0,4,1)
B <- c(0,0,0,9,7,3,1,0,0)
C <- c(0,0,0,3,8,0,1,0,0)
D <- c(0,0,0,0,0,10,5,4,1)
E <- c(0,0,0,0,1,3,2,1,0)
F <- c(0,0,0,6,8,0,3,3,0)
G <- c(0,0,0,0,0,13,5,3,0)
H <- c(0,0,0,0,0,7,4,2,0)

mydata        <- rbind(A,B,C,D,E,F,G,H)
mynames       <- c("0.1875","0.375","0.75","1.5","2.5","3.5","4.5","10","15")
mylegend      <- c("A","B","C","D","E","F","G","H")
mydata.labels <- c("0.1875","0.375","0.75","1.5","2.5","3.5","4.5","10","15")
So when you look at all 118 of them it looks like this:
barplot(A+B+C+D+E+F+G+H, names=mynames, ylim=c(0,35))
But when you separate them by mutations it looks like this. Looking carefully you can see that the distribution of some mutations is shifted to the right (e.g., A) and some to the left (maybe B or F):
barplot(as.matrix(mydata), ylim=c(0,15), beside=TRUE, col=rainbow(8),
        names=mynames, legend=mylegend)
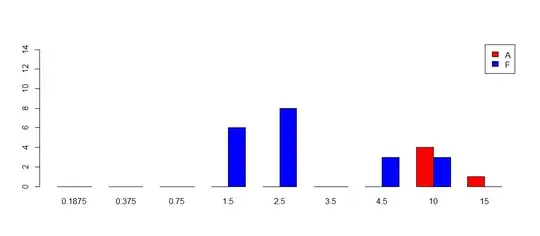
It is rather striking to look at two (A and F) which is why I want to split my mutations into a high/low grouping.
barplot(as.matrix(rbind(A,F)), ylim=c(0,15), col=c("red","blue"), beside=TRUE,
        names=mynames, legend=c("A","F"))
I think that this is what E-M is for but I am not certain. It is not clear because I want to keep my groupings and I am working with counts.
Does anyone have any ideas on how to cluster my data into two groups that is not by eyeball? I tried just playing around with maximizing the group mean difference but it was not satisfying as it seemed somewhat arbitrary.


