11

I performed a linear regression which came out with a significant result however when I checked the scatter-plot for linearity I was not confident that the data was linear.

Are there any other ways to test for linearity without inspecting the scatterplot?

Could the linear regression be significant if it wasn't linear?

[Edited to include scatterplots]
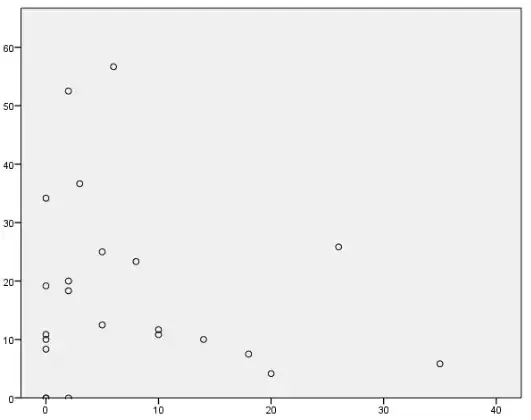
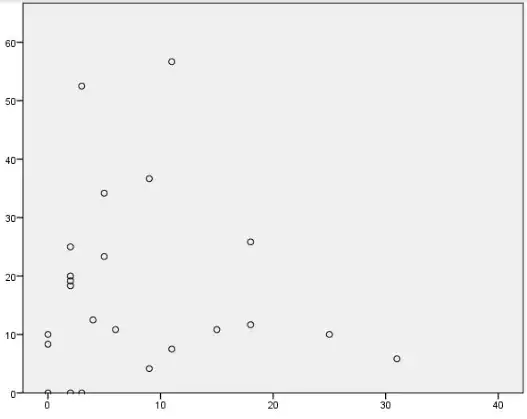
enter image description here

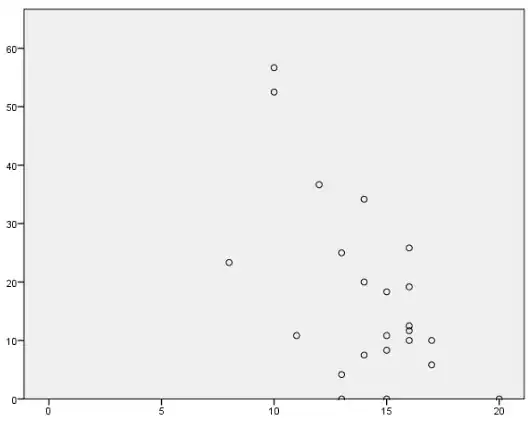
enter image description here

enter image description here

enter image description here

IntoTheBlue
  • 123
  • 2
  • 8
  • 3
    There can be multiple interpretations of the questions and multiple answers (but basically the answer is yes in all cases, and as your outcome proofs it is certainly possible in your case). Can you show the scatterplot? Then others can understand what you mean by data not being linear and in what sense the significant result turned out to be present anyway. – Sextus Empiricus Aug 29 '18 at 17:00
  • 5
    See https://stats.stackexchange.com/search?q=anscombe+quartet for a classical set of simple examples. At https://stats.stackexchange.com/a/152034/919 I posted an algorithm capable of constructing examples to suit almost any circumstance you can think of. – whuber Aug 29 '18 at 17:08
  • Of course *ignoring* nolineararity, even when the general trend is linear can lead to compromised inference in application. For example, if the true relationship is that $Y$ drops sharply, then flattens out across $X$, the *linear* interpretation of the is that $Y$ drops by some average amount over *all* values of $X$, whereas the true relationship is that $Y$ drops much more sharply over a much narrower range of $X$, and over the remaining range of $X$ is more or less unaffected. The linear interpretation would be bad for clinical treatment effects, or for policy expenditure effects. – Alexis Aug 29 '18 at 17:31
  • Also: *linear regression* isn't significant or not, but rather tests of, for example, $H_{0}:\beta_{0} = c$, $H_{0}:\beta_{x} = c$, $H_{0}:F = c$, $H_{0}:R^{2} = c$ may be significant or not, with some degree of independence. – Alexis Aug 29 '18 at 18:55
  • Thanks for the responses and apologies for the slow response - I've been away from technology! I've edited the post to include scattergraphs for those regressions that were significant. Any advice on how to proceed would be greatly appreciated. – IntoTheBlue Sep 04 '18 at 13:06
  • @IntoTheBlue How do you wish to proceed? Your data can be modeled by a linear relationship (it looks a bit like a triangular shape, for higher $y$ you got lower variance and mean for $y$). How is this a problem for you? What is the point? – Sextus Empiricus Sep 04 '18 at 14:11

3 Answers3

19

Monotonic nonlinear relationships will almost always show up significant when modeling as linear models. If the relationship is nonlinear and not monotonic then it depends on the sample.

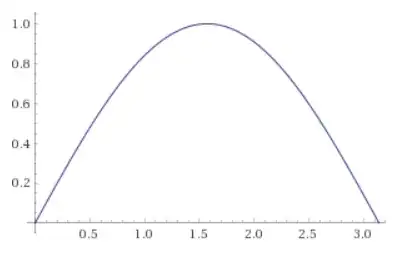
Examples of monotonic relationships is logarithm $y=\ln x$ and odd powers such as $y=x^3$. Example of non monotonic relationships are even powers $y=x^2$ and trigonomtric functions such as $y=\sin x$.

For instance, if your sample is for $x\in[-1,1]$, then $y=\sin x$ modeled as $y\sim x$ will likely be significant, see the plot:

enter image description here

However, if your sample is in $x\in[0,\pi]$, then linear modeling will not work at all: enter image description here

Aksakal
  • 55,939
  • 5
  • 90
  • 176
  • 13
    +1. But please note that the correct term is "monotonic." "Monotonous" means dull and tedious through repetition. – whuber Aug 29 '18 at 17:26
  • 23
    @whuber, edited my answer, but one must agree that $\ln x$ is dull and tedious compared to buoyant and joyful $\sin x$ – Aksakal Aug 29 '18 at 17:52
  • +1 I'd also suggest defining what monotonic means. – Mark White Aug 29 '18 at 17:56
  • Thankyou, I've updated the post to include scatterplots. Any advice on how to proceed would be greatly appreciated. – IntoTheBlue Sep 04 '18 at 13:07
  • I don't know if there's a test for linearity per se. You could add nonlinear regression terms and test their significance, e.g. $(x-\bar x)^2$. – Aksakal Sep 04 '18 at 13:39
3

Yes, Aksakal is right and a linear regression can be significant if the true relationship is non-linear. A linear regression finds a line of best fit through your data and simply tests, whether the slope is significantly different from 0.

Before trying to find a statistical test for non-linearity, I would suggest reflecting on what you want to model first. Are you expecting a linear (non-linear) relationship between your two variables? What exactly are you trying to uncover? If it makes sense to assume that there is a non-linear relationship as for example between car speed and braking distance, then you can add squared terms (or other transformations) of your independent variable.

Also, a visual inspection of your data (scatterplot) is a very powerful method and an essential first step in your analysis.

Pawel
  • 31
  • 1
  • Almost got my up-vote until "then you can add squared terms (or other transformations) of your independent variable". A quadratic relationship is just as arbitrary as a linear relationship. I think non-parametric regressions which make much more generalized assumptions about the functional form relation $Y$ to $X$ (followed by linear and/or nonlinear regression as appropriate if parametric estimates are needed), or algorithmic curve-fitting (e.g., fractional polynomials), possibly even shifting to maximal information coefficient approaches for generalized beyond even functional relationships. – Alexis Aug 30 '18 at 16:36
  • Also: Welcome to CV, Pawel! – Alexis Aug 30 '18 at 16:36
  • 2
    @Alexis You'r right. But adding a quadratic term is still a commonly-seen recommendation in some texts as a quick-and-dirty way to check for nonlinearity (understanding nobody is suggesting it is the only or even the first way to model nonlinearities), so I'm not quite as concerned about that passage. – whuber Aug 30 '18 at 17:16
  • +1 @whuber Sadly, I've encountered many researchers, students and faculty practicing adding a quadratic term as the first check beyond eyeballing a scatter plot as "how to test for nonlinearity", with a negative result being interpreted as "linear is sufficient". (Quadratic terms can indeed be useful, and I have used them in my own research. :) I guess my perspective on "quick and dirty" is that the stuff that gets taught as easy, becomes *de rigour* for the overwhelming majority of researchers... I think nonparametric regressions are about as "easy" as linear and a better tool for exploring. – Alexis Aug 30 '18 at 17:23
  • @Alexis Thank you. I think you have misunderstood me. I wasn't recommending to add squared terms to test for non-linearity but there definitely can be made cases for squared terms (or other transformations. economic data are often log-transformed). I think there needs to be a distinction between exploratory and explanatory analysis. If there are substantiated grounds to assume a squared relationship then this needs to be tested. What you are proposing is a more exploratory approach. – Pawel Aug 31 '18 at 09:48
  • It really depends on the aims of the analysis, the research design and the data. – Pawel Aug 31 '18 at 09:59
  • Thankyou for the reply. I've updated the post to include the scatterplots for significant regressions and would be greatful for any advice on how to proceed. – IntoTheBlue Sep 04 '18 at 13:08
-2

I agree with everything Aksakal says. But as to the first question I think the answer is correlation. Correlation measures the extent to which there is a linear relationship between the data sets x and y.

meh
  • 1,902
  • 13
  • 18
  • 2
    By "first question", do you mean, "Are there any other ways to test for linearity without inspecting the scatterplot?"? If so, how would correlation be an answer & "everything Aksakal says" be correct at the same time? Eg, $y=\ln x$ is not linear, but will yield a significant correlation, as Aksakal correctly notes. Thus, correlation couldn't be an answer. Can you clarify what you are saying here? – gung - Reinstate Monica Aug 29 '18 at 19:07
  • @gung Yes I do. What statement of his do you consider incorrect ? Allow me to suggest that I understand what the words linear and non-linear mean and that, as in Aksakal's answer, it is really easy to find examples of variables with an exact and non-linear relationship. Nonetheless, correlation is a measure of the linear relationship and a correlation of +/-1 means that the relationship is indeed linear. Any correlation less than that means that the relationship is (not exactly) linear but it may be close enough. – meh Aug 29 '18 at 21:55
  • 1
    The OP "performed a linear regression which came out with a significant result", but the scatterplot implied the relationship was not linear. A correlation would likely also have been significant, in fact, if the regression had only 1 X-variable, the p-values from the regression & the correlation would be identical. But if the relationship wasn't linear despite the significant regression, it would still not be linear despite the significant correlation. Thus, a significant correlation is not evidence that the relationship is linear. – gung - Reinstate Monica Aug 30 '18 at 00:14
  • 1
    Moreover, you won't get $r=1$ unless the relationship is deterministic. Thus, you can very well have linear relationships w/o finding $r=1$. That is, checking if the value of $r$ is $1$ isn't a good way to determine this either. – gung - Reinstate Monica Aug 30 '18 at 00:16
  • 1
    This may sound overly subtle or even nitpicking, but (a) I agree that correlation is a way to measure linearity of a bivariate relationship--that's a mathematical theorem, after all--but (b) as a general proposition, I doubt that it could be construed as any more than an extremely crude way to assess *nonlinearity.* Evidence of nonlinearity can be striking in a dataset with high absolute sample correlation and be completely absent in a dataset with small absolute correlation. (cc @gung) – whuber Aug 30 '18 at 17:20