0

I have two ordinal variables. I would like to know if there is a dependency between these two variables and also how strong this dependency is. So, I performed a chi-square test (34.53, df=8) where the p-value < 0.05. No problem here.

Then because these two variables are ordinal I choose gamma and Somers' d to show how strong the dependency is. The problem is that both Somers' d (-0.036) and gamma (-0.056) show no statistical significance p-value for both 0.345.

I don't know how to interpret these results: there is statistical significance in dependency (chi-square) and also no statistical significance in the strength of this dependency ?
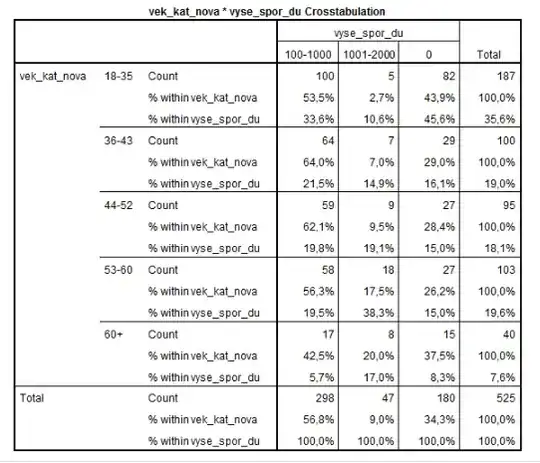
Crosstabulation

user210804
  • 13
  • 3
  • Can you provide a graph. A scatterplot. Real units do not matter. – AlainD Aug 22 '18 at 08:36
  • A 5 x 3 table of frequencies would be even better. (It allows drawing suitable graphs too.) – Nick Cox Aug 22 '18 at 08:47
  • Note: spelling is Somers, not sommers. (Robert H. Somers). – Nick Cox Aug 22 '18 at 08:47
  • 1
    Please explain how a variable with categories 100-1000, 1001-2000, 0 is ordinal. If it is, why is that the right order? – Nick Cox Aug 22 '18 at 09:00
  • Robert Hough Somers (1929--2004). – Nick Cox Aug 22 '18 at 09:06
  • You think that the problem is that the last column is not first ? Because of this I obtain these results ? I think that if I can meaningfully order categories then I have ordinal variable 0-100 is smaller than 100-1000 and this is smaller than 1001-2000. – user210804 Aug 22 '18 at 09:10
  • I don't know anything about this variable that you're not telling me. Please translate to English (from Czech???). Should 0 be 0-100? Why does SPSS (?) think the variable has that order? What did you tell your software? – Nick Cox Aug 22 '18 at 09:20
  • In rows are age categories and in columns are categories for money savings. Another words is there a dependency between age and how much money peole save ? Here is the thing I don't know if the right category is just 0 or should be 0-100. And why SPSS order columns in this way also don't know. Is there a posibility that the order of columns for calculation matter ? – user210804 Aug 22 '18 at 09:31
  • 2
    Yes; the ordering of rows and/or columns is crucial for measures of ordinal association. I confirm your chi-square result using Stata. If you order 0-99 [NB], 100-1000, 1001-2000 then Somers' d I get as 0.13682421 with P-value .00004898, also using Stata. . – Nick Cox Aug 22 '18 at 09:43
  • 1
    @NickCox has probably solved one issue: that the ordinal categories weren't in the correct order. But you should also understand that a chi-square test of association and testing (?) with either gamma or Somers' d treat the data as very different things. Or, you could say that they test very different hypotheses. You should decide ahead of time if you are treating a variable as ordered categorical or nominal (unordered) categorical. It doesn't make much sense to use gamma or Somers' d as an effect size statistic after a chi-square test of association. – Sal Mangiafico Aug 22 '18 at 11:01
  • @Sal Mangiafico Yes of course, I completly see your point. I know on the internet is a lot of garbage tutorials in one of them there was written first chi-square then Somers'd or gamma. On the other hand if I could not calculate chi-square because I was decided ahead that I want to treated my variables as ordinal then my error with ordering of columns could not be revealed. Then I will report garbage results. After this experience, I think that it was a good thing to calculate both, because I could immediately see contradiction. What do you think about this ? – user210804 Aug 22 '18 at 16:19
  • Well, I think it's possible to think about the data as either nominal or ordinal, and perhaps to treat one variable as nominal and the other ordinal. I'm in favor of exploring the data to see what's there, but you also don't want to fall into the practice of testing a bunch of things and then keeping whatever came out significant. Since the tests are different, they test different things. The tests with ordinal categories test for trends. High, low, high counts would be different across nominal categories, but may not be a trend across ordinal categories. – Sal Mangiafico Aug 22 '18 at 16:30

0 Answers0