7

I am calculating a tolerance interval following http://www.itl.nist.gov/div898/handbook/prc/section2/prc253.htm but this says to multiply the k value by the standard deviation of the sample. I have a model with a fit line, so I would think I do not want to use the standard deviation, but rather some value that reflects the residuals, and instead of using the sample mean, I will use the predicted value from my linear regression model. Is that right? What value do I use instead of the standard deviation?

I could (maybe should have) asked the question this way: Given a linear model, how do I compute a one-sided tolerance interval. I think a tolerance interval is the right thing for my problem based on this: http://www.kmjn.org/notes/tolerance_intervals.html

Edit again: I found this formula for "Assuming linear function and no replicates, the standard deviation about the regression" (from here)

standard deviation about the regression formula

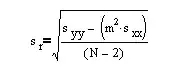
Is this the right fomula to get a value to multiply by the k values?

Michael R. Chernick
  • 39,640
  • 28
  • 74
  • 143
Aerik
  • 229
  • 2
  • 10
  • Just to be sure this is headed in the right direction for you, how do you plan to interpret this tolerance interval? – whuber Sep 14 '12 at 19:01
  • What I want to do is say this: "Given a linear model based on this sample, we are 90% sure that 90% of the population with a factor of at least x, will have a response of at least y". – Aerik Sep 14 '12 at 21:32
  • So then this is a "one directional bivariate tolerance region that you want? I am trying to say that it is the bivariate equivalent of a one-sided interval. If this is case, why don't you want a retangular region? Isn't underpredicting as important as overpredicting? – Michael R. Chernick Sep 14 '12 at 21:58
  • Come to think of it wouldn't you want for prediction a two-sided confidence interval for the prediction of y given the value of x? – Michael R. Chernick Sep 14 '12 at 22:00
  • Aerik, your interpretation requires additional information: the "at least" part needs knowledge of what proportion of the population has a factor of at least $x$. If, instead, you were to ask for $1-\alpha$ confidence that at least $1-\gamma$ proportion of the population with factor *equal* to $x$ will respond at least $y$, then this could be computed. It involves both the variance of the population--as estimated from the residual variance--and the uncertainties in the regression coefficients. Alas, the latter implies you cannot simply plug the residual variance in to the NIST formulas. – whuber Sep 14 '12 at 22:23
  • Well, if I can solve " 1−α confidence that at least 1−γ proportion of the population with factor equal to x will respond at least y", and I look at the slope of my fit line, then can have a pretty good idea about what increasing x will do to y.... cont'd – Aerik Sep 14 '12 at 22:51
  • This is actually my second pass at solving this problem. My first is this question: http://stats.stackexchange.com/questions/36181/how-to-i-find-out-where-the-lower-bounds-of-a-tolerance-interval-crosses-a-given. My idea: If I can get the k values and predicted responses (y) for every factor (x) in my sample, AND the appropriate value to use instead of std deviation, then I can fit a line to the lower tolerance interval. Once I have that, I have a model for predicting whatever percentage of my population with whatever confidence. – Aerik Sep 14 '12 at 22:56
  • Doesn't `tolerance::regtol.int` already do this for you? – whuber Sep 14 '12 at 23:07
  • tolerance::regtol.int gives me back actual y values, predicted y values, and the the tolerance interval bounds (either one sided or two sided). Its results are sorted by predicted y, so in any situation where I have duplicated y values or predicted y values, I can't determine which x values go with which tolerance intervals. R apparently handles this behind the scenes somewhere, because tolerance::plottol takes care of it just fine... though I have no idea how. – Aerik Sep 14 '12 at 23:16
  • 2
    It's a bizarre interface. Use `regtol.int(fit, numeric(0), side=2, alpha=.05, P=.90)` to obtain the tolerance limits for the actual x-values (in the order they appeared in the original linear model). In the general case, it appears you can select out the rows for which the "y" column is NA to find the tolerance limits associated with the `new.x` parameter. Better yet, just modify the code for `regtol.int` to include the x-coordinates in its output: then you'll be sure they're correct. – whuber Sep 14 '12 at 23:20
  • Holy mackeral. I didn't know you could even do that. (I just dumped the function, copied it, and pasted it with changes) – Aerik Sep 15 '12 at 00:13
  • @whuber you provided a reasonable way of answering - or at least getting an approximate answer to - my other question (http://stats.stackexchange.com/questions/36181/how-to-i-find-out-where-the-lower-bounds-of-a-tolerance-interval-crosses-a-given) - do you want to answer that one? Thanks, – Aerik Sep 17 '12 at 17:19

1 Answers1

-1

As the question is now posed you are looking for the standard deviation to multiple by the appropriate tabled k for prediction one-sided tolerance interval for y given x. The appropriate standard deviation is the standard deviation of the prediction estimate of y given x not the standard deviation of the residuals. The right standard deviation is obtained by taking the variance for the fitted y given x and adding one estimate of the residual variance and taking the square root. This is because the prediction is the same as the fitted value but the actual value of a new y at the given x differs from the "true" model by an independent error term. So to take account of that the residual variance must be added to the variance of the difference between the "true" y given x and the model fit for it. The sample estimate just replaces the true variance terms with the estimates used in the regression for fit and the error term.

The resulting formulae taken from Chernick 2011 "The Essentials of Biostatistics for Physicians, Nurses, and Clinicians" pp. 102-103 is as follows:

SSx = ∑(X$_i$ - X$_b$)$^2$ where X$_b$ = ∑X$_i$/n

SSE = ∑(Y$_i$ - Y$_b$)$^2$ where Y$_b$ = ∑Y$_i$/n

Then the standard error of the estimate is S$_y$$_.$$_x$=√[SSE/(n-2)].

Next we have the standard error for the fitted Y given X=x is as follows:

SE(Y^) = S$_y$$_.$$_x$ √[(x-X$_b$)$^2$/SSx+1/n] But for prediction we need to add one more S$_y$$_.$$_x$$^2$ term to the get the variance of the prediction. Hence the standard error for prediction of Y given X=x is:

SE(Y$_p$$_r$$_e$$_d$)= S$_y$$_.$$_x$ √[1+(x-X$_b$)$^2$/SSx+1/n].

The constant you need with it will be the one for one-sided Gaussian confidence intervals for the confidence level and coverage that you specify. The tables can be found in the statistical intervals book by Hahn and Meeker.

Michael R. Chernick
  • 39,640
  • 28
  • 74
  • 143
  • I've read your answer twice, and can't quite understand it (I'm sorry). The part I'm particularly having a problem with is "The right standard deviation is obtained by taking the variance for the fitted y given x and adding one estimate of the residual variance and taking the square root." Could you post a formula with definitions of the variables? – Aerik Sep 17 '12 at 17:16
  • The comment should not be confusing. There is a standard formula for the variance in the estimate of y. The idea is that prediction adds an additional residual error variance term to it. I was just trying to describe it without putting in formulae that you could look up. The important point is that your conjecture that the residual variance is the variance for prediction is worng. I will add the correct formula to my answer shortly. – Michael R. Chernick Sep 17 '12 at 17:22
  • @Aerik Take a look at my edited asnwer with the formulae now supplied and let me know if that clarifies it better. – Michael R. Chernick Sep 17 '12 at 18:48
  • What precisely is the relationship between the *prediction* intervals you discuss here and the *tolerance* intervals of the question? (You might have tried to explain this in your first sentence, but it just doesn't scan--maybe some words are missing?) – whuber Sep 17 '12 at 21:10
  • I am sorry. The OP talked about an interval centered around a prediction for y. That got me to thinking about prdiction intervals. If he is talking about the distribution of the prediction for a tolerance interval the relevant standard deviation would still be for prediction. The constant k would differ because it would be the larger one that corresponds to say 95% confidence for say 90% coverage. – Michael R. Chernick Sep 17 '12 at 22:51