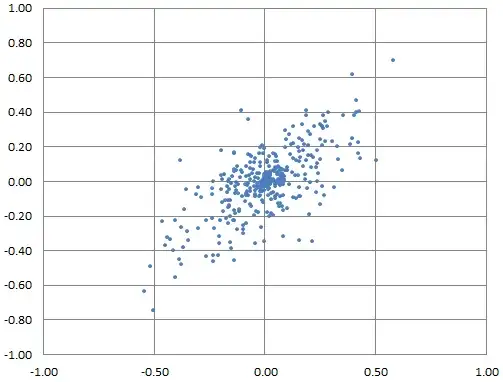
I have a data set $\vec P$ which consists of two arrays of coordinates $X$ and $Y$. I can calculate $\sigma X$ and $\sigma Y$, and derive the standard deviation of the vector lengths by $\sqrt{\sigma X^2+\sigma Y^2}$. However the data is often correlated. An example is provided:

I need to determine the angle of the semi-major axis by computing the eigenvector of the covariance matrix (edit: the original formula I posted here was wrong).
Next I need to draw an error ellipse at 1-sigma. So, I have the orientation of the ellipse, but I need the length of the axes. For this I need to calculate the standard deviation along the semi-major axis $L_1$ (in the example provided it's 45°). That's where I'm having trouble and I can't find anything related on Google. By brute force I could rotate every point by this angle and then calculate the standard deviation along the x-axis, but my gut tells me there must be a simpler way.
I should then be able to compute the eccentricity by $1-\frac{\sigma L_2}{\sigma L_1}$ and then draw my circle. I'm doing this in Excel so to plot the circle I'm just calculating a flattened circle and rotating each point (I also feel there should be a simpler way to do this) and plotting it on the graph.
Is there a simpler way to calculate the standard deviation of these points with respect to an arbitrary axis?
Thanks in advance.