As I dig deeper than surface level in probability I'm starting to ask more questions I never thought about before.
There are a bunch of intertwined concepts that are quickly becoming confused in my head:
Probability Density Function/Probability Function: This tells us the probability of some value $x$ being equal to (in the case of a discrete distribution) or bounded by some $(a, b]$ in the event of a continuous distribution. Given that $P(a \le x \le a) = 0$ to use a continuous PDF we need some bounds for calculation.
Distribution Function defines $P(X \le x)$ which can also be defined as the integral from $-\inf$ to $x$ of the density function $f_x$: $\int \limits_{-\inf}^xf_x(x)dx$.
The density function's integral from negative infinity to infinity must be 1 - that is the area under the curve of the density function must be equal to 1.
So far so good (I think). Reading through the wikipedia entry for Probability Density Functions though it has some strange language that leads me to confusion.
The standard normal distribution has probability density $f_x(x) = \frac{1}{\sqrt{2\pi}}e^{-\frac{x^2}{2}}$
This density function is common knowledge and can be used to determine the probability of an event occurring.
The part where I am confused (and this leads to the title question) is the term
the standard normal distribution has probability density...
The implication here, of course, being the standard normal distribution being something unrelated to probability.
Suppose I draw a number from a standard normal distribution in python:
>>> import numpy as np
>>> np.random.normal(0, 1)
-0.8071008841914297
-0.8071008841914297 is clearly not a probability.
So when I draw a number from a normal distribution what is it actually? Taking a stab at it I would say:
"-0.8071008841914297" is the value (x-axis of the probability density function) of a normal distribution $N(0, 1)$. Plugging this value into the Distribution Function I would be using the integral above to find $P(X \le -0.8071008841914297)$.
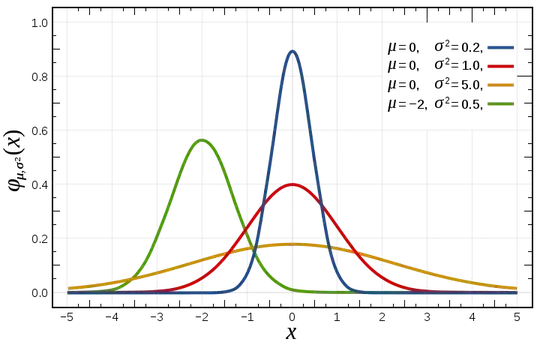
But this still leaves me confused - what exactly then is a normal distribution? What does it look like? I can only find (and produce myself) images of the probability density function (this one stolen shamelessly from wikipedia):
Is this actually the normal distribution, and the probability density function is the function that defines the area under the curve?
EDIT:
Taking another stab at it:
A normal distribution is a way to describe the "look" of a continuous random variable. What I mean by "look" is how many of each possible value there are.
If we then assigned each $x$ in a continuous distribution a probability of occurring $p$, plotting these values would give us the graph above. The density function then tells us analytically the probability of any event we ask for occurring in this random variable.
