0

I have a 2D binary array (size 1445 by 120), which I have clustered into 10 clusters using Python's AgglomerativeClustering method. Each of the 1445 samples is given a cluster index of a number from 0-9.

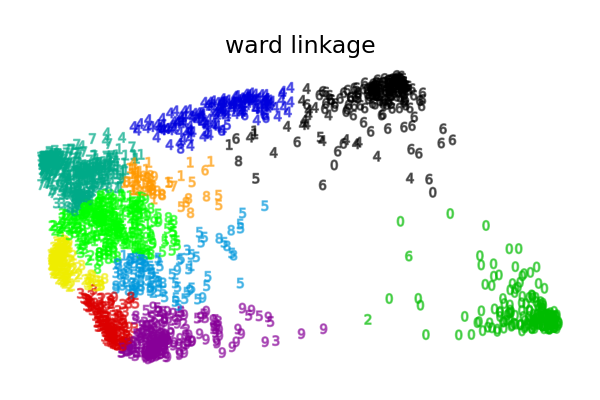
My question is this: Is there a way to visualize these clusters in a 2D space, so that it looks something like this?: http://scikit-learn.org/stable/_images/sphx_glr_plot_digits_linkage_001.png. I'm having trouble thinking of a way to map 2D binary data into coordinates. The data is very sparse and only ~5% are 1s, the rest are 0s. Any thoughts?

Cynthia
  • 73
  • 1
  • 2
  • 7
  • 1
    If I understand you correctly, you have 1445 observations in 120 dimensions, correct? – Stephan Kolassa Jul 31 '18 at 19:12
  • You are correct in that it is 1445 samples, although I wouldn't call it 120 dimensions. A sample might look something like this: [0, 0, 0, 0, 1, 0, 0, 0, 0, 0 .... 0, 1, 0, 0, ...] – Cynthia Jul 31 '18 at 20:50
  • 1
    120 features sounds like 120 dimensions to me. You can follow the approach for visualizing high-dimensional clusterings in the duplicate I proposed, although I do not know how well MDS performs on binary data. If this does not answer your question, please consider explaining what is missing there. Note that [Euclidean distance is problematic in high dimensions](https://stats.stackexchange.com/q/99171/1352). – Stephan Kolassa Aug 01 '18 at 06:18

0 Answers0