3

I have an engine that runs a game, and bots that perform strategies in it. I want to do different tests of versions of a single bot, to see how variations influence success. For instance, if I have Bot A1 and Bot A2, I might run the following trials:

Trial 0

  • Bot A1
  • Bot B
  • Bot C
  • Bot D

Trial 1

  • Bot A2
  • Bot B
  • Bot C
  • Bot D

Each trial consists of many games, so the end result is something like this:

Bot \ Place    1st  2nd  3rd  4th

A1             3    8    2    1
B              1    4    7    2
C              0    2    3    9
D              10   0    2    2

So, for the above trial, Bot A1 won the 3 games, was 2nd 8 times, came in last once, etc.

I'm looking for a way to compare two trials to see if the difference between them is statistically significant. What method is best for doing this?

(It's been a few years since I've done stats, so please forgive me if I'm missing information in this question. Also, if you think I'm completely off-base and there's another approach to determine which strategies are most effective, please let me know.)

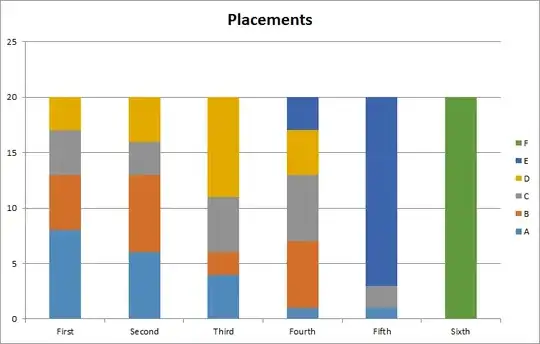
Update: I will arbitrarily decide that the way to rank bots is by looking at who comes in most in each place. (First, take whichever bot came in first the most times, then take whichever bot came in second the most times, etc.) For the above example, that would look like D, A1, B, C. Also, I'm using F#, for what it's worth.

Here is a chart generated from a single trial (actual run-through of the program; not related to the sample data above). The bots are named alphabetically by how well they did in the ranking I described in the previous paragraph (so A was better than B, etc).

chart showing the ranking of bots is A, B, C, D, E, F

Nick Heiner
  • 235
  • 2
  • 6
  • Are you interested only in proportion of 1st place finishes? Or in who finished better on the most games? Do you want to weight the results so that if (say) botA comes 1st and botB 4th it means more than if botA comes 1st and botB second? – Peter Flom Sep 03 '12 at 19:02
  • To be honest, I'm not sure what the best measure of bot quality is. I would say that yes, I am interested in which bot did better on the whole, not just 1st place finishes, and 1st and 4th should be considered a bigger difference than 1st and 2nd. – Nick Heiner Sep 03 '12 at 19:42
  • See [this thread](http://stats.stackexchange.com/questions/97/what-are-good-basic-statistics-to-use-for-ordinal-data) which may answer your question. If not, then try to say why not. – Peter Flom Sep 03 '12 at 19:53
  • 1
    You have to decide whether ($1/3$ $1$st, $1/3$ $2$nd, $1/3$ $3$rd) is better or worse than ($1/6$ $1$st, $2/3$ $2$nd, $1/6$ $3$rd), or ($1/2$ $1$st, $1/2$ $3$rd). We can't make that decision for you. If you have a linear evaluation of each place, then you could try evaluating bots by their expected values, and you can test significance after estimating the standard deviations of those values. – Douglas Zare Sep 03 '12 at 22:32
  • I've updated my question to hopefully resolve the ambiguity. – Nick Heiner Sep 04 '12 at 18:31

1 Answers1

2

If all that matters is 1st v not-1st you can do a simple test comparing proportions, on which there is plenty of information on the web.

A possibility that makes the most of your ordered data and takes a bit more into account than just 1st place v not-1st place would be proportional odds logistic regression. There are a number of ways of implementing this, the way below is in R.

For the sake of illustration, I assume that A2's results are 5 wins, 5 second place, 4 third, and no lasts. The results in this case suggest a lack of statistically significant evidence that A2 does better than A1.

# load in Venables and Ripley's library of functions including polr()
> library(MASS)

# create test dataset
> test <- data.frame(results = ordered(c(rep(1:4, c(3,8,2,1)), rep(1:4, c(5,5,4,0)))),
+ bot=rep(c("A1", "A2"), c(14,14)))

# print the test data frame to the screen so you can see what it looks like
> test
   results bot
1        1  A1
2        1  A1
3        1  A1
4        2  A1
5        2  A1
6        2  A1
7        2  A1
8        2  A1
9        2  A1
10       2  A1
11       2  A1
12       3  A1
13       3  A1
14       4  A1
15       1  A2
16       1  A2
17       1  A2
18       1  A2
19       1  A2
20       2  A2
21       2  A2
22       2  A2
23       2  A2
24       2  A2
25       3  A2
26       3  A2
27       3  A2
28       3  A2

# fit a proportional odds logistic regression model
# with "bot" as an explanatory variable
> mod1 <- polr(results ~ bot, data=test)

# fit a model without bot as an explanatory variable,
# so there is just an intercept
> mod2 <- polr(results ~ 1, data=test)

# summarise the first model we made
# All the text below is output.
> summary(mod1)

Re-fitting to get Hessian

Call:
polr(formula = results ~ bot, data = test)

Coefficients:
       Value Std. Error t value
botA2 -0.266      0.706  -0.377

Intercepts:
    Value  Std. Error t value
1|2 -1.045  0.543     -1.924 
2|3  0.974  0.545      1.787 
3|4  3.167  1.072      2.955 

Residual Deviance: 65.00 
AIC: 73.00 


# Compare the two models, including with a likelihood ratio
# test of whether the deviance goes down enough with the 
# inclusion of "bot" to justify it (it doesn't).
> anova(mod2, mod1)
Likelihood ratio tests of ordinal regression models

Response: results
  Model Resid. df Resid. Dev   Test    Df LR stat. Pr(Chi)
1     1        25      65.14                              
2   bot        24      65.00 1 vs 2     1   0.1423   0.706
Peter Ellis
  • 16,522
  • 1
  • 44
  • 82
  • This looks like it could be what I'm looking for, but I don't know anything about R. Can you annotate the output a bit? Also, I'm looking around but I'm having a hard time finding a description of the algorithm I can implement in F#. Could you point me in the right direction? – Nick Heiner Sep 04 '12 at 18:58
  • I've added some annotations (lines starting with #) in the code. I imagine F# can do this - it can do the simpler case of logistic regression - but I think you would have a fair bit of work. R is free and not too hard to learn. – Peter Ellis Sep 05 '12 at 19:26
  • Ok, thanks, that makes it easier to understand what's going on. I'd rather stick to F#, because I'd like it to be integrated with the rest of my app. I'm having a hard time finding somewhere that spells out an algorithm I can translate into F# - do you know where I should look for that? – Nick Heiner Sep 08 '12 at 02:29