I am testing the backpropagation algorithm for a multilayer perceptron. My net architecture have 3 neurons with sigmoid as activation function. My data is came from a linear regression problem, but I'm just trying to implement the regression with neural networks. The problem is, my net is not predicting the values. As far as I know, a neural network can approximate a huge number of functions beacuse of its non-linearity, but in this case, is a linear problem. Should it be easier to it to predict the results? Below I write the code: I'm using Python 3 with Anaconda 3.6 environment.
import matplotlib.pyplot as plt
import numpy as np
from scipy import stats
import random

random.seed(1)

def sigmoid(x):
    return 1./(1 + np.exp(-x))

def sigmoid_(x):
    return sigmoid(x)*(1-sigmoid(x))

income = np.array([685, 683, 526, 662, 536, 627, 520, 423,
          343, 513, 462, 383, 460, 517, 454, 448,
          1076, 970, 722, 681, 814, 800, 782, 775,
          689, 731, 1499])

income_ = income/np.max(income)

scholarship = np.array([5.7, 6, 4.5, 4.9, 4.7, 5.5, 4.5, 3.9,
               3.6, 4.5, 4.3, 3.5, 4.1, 4.6, 3.7, 4,
               6.8, 7.1, 5.7, 5.4, 6.3, 6.4, 6, 5.4,
               5.5, 5.7, 8.2])

scholarship_ = scholarship/np.max(scholarship)

w1 = np.random.uniform(0.5, 1.5, size = (3, 1))
w2 = np.random.uniform(0.5, 1.5, size = (1, 3))
b1 = np.random.uniform(0.5, 1.5, size = (3, 1))
b2 = np.random.uniform(0.5, 1.5, size = (1, 1))

eta = 0.05
emax = 1e-7

epoch = 30
E = 0

for i in range(epoch):
    E_ = E

    for j in range(len(income)):
        i1 = np.dot(w1, np.array([[scholarship_[j]]])) + b1
        y1 = sigmoid(i1)
        i2 = np.dot(w2, y1) + b2

        dW2 = np.dot((income_[j] - i2), sigmoid_(i2))
        w2 += eta*dW2*y1.T
        b2 += eta*dW2

        dW1 = np.dot(dW2, w2).T * sigmoid_(i1)
        w1 += eta*dW1*np.array([scholarship_[j]])
        b1 += eta*dW1

    E = []

    for k in range(len(income)):
        i1 = np.dot(w1, np.array([[scholarship_[k]]])) + b1
        y1 = sigmoid(i1)
        i2 = np.dot(w2, y1) + b2
        E.append((income_[k] - i2[0][0])**2)

    E = sum(E)/(2*len(E))

    if abs(E_ - E) <= emax:
        break

    print('Error: ', E, ' at epoch: ', i)

nn = []

for l in range(len(income)):
        i1 = np.dot(w1, np.array([[scholarship_[l]]])) + b1
        y1 = sigmoid(i1)
        i2 = np.dot(w2, y1) + b2
        nn.append(i2[0][0])

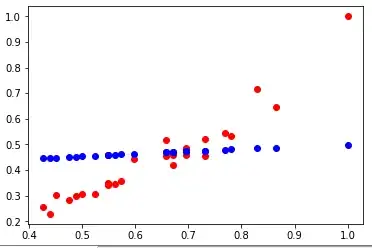
plt.plot(scholarship_, income_, 'ro', scholarship_, nn, 'bo')
plt.show()
plt.plot(income_, nn, 'yo')
plt.show()
And the resulting graphs are:
The red points are the x data with y data, the blue one are the x data with the net predicts
