If one wanted to construct a simple pairwise correlation matrix from an compositional data table using an ILR transform preprocessing step, would this usage violate any assumptions with the transform?
Is it valid to use the ILR transform with respect to the attributes instead of the samples if they are scaled?
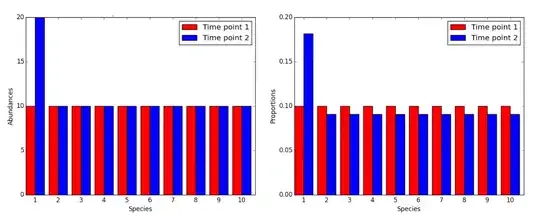
The ILR transform is for compositional data which is essentially a sample of a population in the form of integer counts. This data has the problem of some samples containing more total counts than others so many methods like correlation can be skewed. The following figure illustrates the situation of 2 populations having the same counts for all attributes except one. When the populations are compared, most attributes appear to be down-regulated when in reality there is only one that is upregulated in one of the populations.
 https://docs.qiime2.org/2018.6/tutorials/gneiss/
Essentially, the below code does the following:
(1) Generate random compositional data table
(2) Transform to relative abundance so each sample/row sums to 1
(3) ILR transform along axis 0 to end up (n-1 samples, m=attributes)
(4) Pairwise correlation
from skbio.stats.composition import ilr
# Utility functions
def generate_compositional_data(shape=(8,13), random_state=0):
def get_labels(prefix, size):
return list(map(lambda x:"_".join([prefix, str(x)]), range(size)))
data = np.random.RandomState(random_state).randint(low=0, high=1000, size=shape)
return pd.DataFrame(data,
index=get_labels("patient",shape[0]),
columns=get_labels("Otu",shape[1]),
)
def relative_abundance(X):
scaling_factor = X.sum(axis=1).values.reshape((-1,1))
return pd.DataFrame(X.values/scaling_factor, index=X.index, columns=X.columns)
# Generate data
df_otus = generate_compositional_data()
df_otus.sum(axis=1)
# patient_0 7295
# patient_1 5903
# patient_2 8105
# patient_3 7315
# patient_4 6269
# patient_5 6351
# patient_6 6545
# patient_7 6163
# dtype: int64
# Relative abundance
df_scaled = relative_abundance(df_otus)
df_scaled.sum(axis=1)
# patient_0 1.0
# patient_1 1.0
# patient_2 1.0
# patient_3 1.0
# patient_4 1.0
# patient_5 1.0
# patient_6 1.0
# patient_7 1.0
# dtype: float64
df_ilr = pd.DataFrame(ilr(df_scaled.T).T, columns=df_scaled.columns)
# print(df_ilr.head())
# Otu_0 Otu_1 Otu_2 Otu_3 Otu_4 Otu_5 Otu_6 \
# 0 -0.055884 1.319409 0.053333 -0.955416 0.377799 0.478101 -0.147712
# 1 0.126634 -0.643007 -0.185855 1.438424 -0.073371 -0.339283 1.654090
# 2 -0.196348 0.920854 -0.352120 0.149329 -0.115821 -0.208206 -0.431096
# 3 -0.112610 -1.092643 0.119336 -1.024966 -0.177794 0.759426 0.845943
# 4 -0.208179 0.587506 1.430151 -1.318172 2.240699 -0.560585 -0.477439
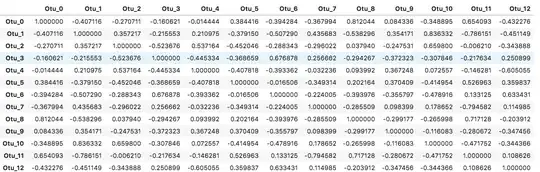
df_sim = df_ilr.corr()
df_sim