0

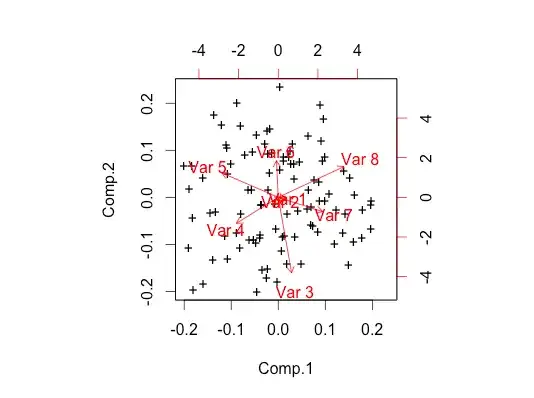
I just wanted to do this small experiment to make sure I understand PCA correctly. My dataset contains 8 columns. The first two columns are randomly generated in excel => randbetween(4, 5) and the other 6 columns are also generated in the same way but the formula used is => randbetween(1,3)

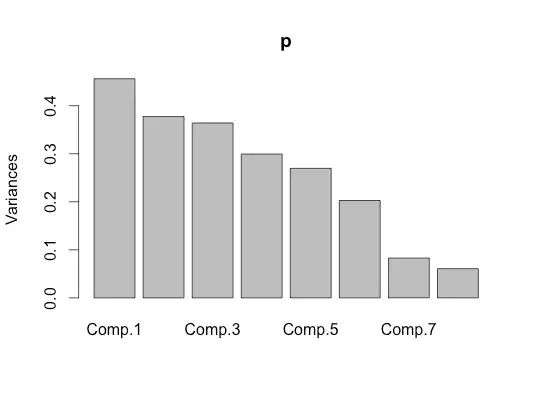
When I do PCA on this I am not getting good results. I expect that the result should indicate high eigenvalues for a factor that is a combination of first two columns and low on other colums. This is my code in R :

sensex.dat = read.csv('C:/Study/_SEM4/brand man/emperical/dice.csv', header = T)
attach(sensex.dat)
sensex.cov = cov(sensex.dat)
sensex.eigen = eigen(sensex.cov, symmetric = T)
sensex.eigen$values
sensex.eigen$vectors
Prakhar
  • 103
  • 3
  • Can you explain _why_ you expected that result? That is probably the most important information if you want to know whether you've understood PCA correctly. :) – MånsT Aug 31 '12 at 05:39
  • The first 2 factors behave similarly and differently from the others, so shouldn't PCA combine the first 2 factors as one factor? – Prakhar Aug 31 '12 at 05:57
  • 3
    No, because 'behave similarly' means 'be Pearson correlated' for PCA. Amplitude does not really matter. –  Aug 31 '12 at 06:11
  • 1
    For a working `R` example of how to construct a random dataset with specific PCA output and how to compare the actual output to the intended output, please see the answer at http://stats.stackexchange.com/a/35035. – whuber Aug 31 '12 at 13:38

2 Answers2

2

As others have told you PCA does not look for amplitude - in fact it is standard procedure to normalize your variables before a PCA. You did not do this by the way. It looks for correlations between the columns.

The result you want to generate you would get by

  1. Randomly generating a column
  2. Generating a second random column with similar parameters but also adding the first column to it. In your example this would basically be first column + randbetween.
  3. Generate additional uncorrelated columns as in 1
  4. Normalize and then get eigenvalues and vectors
Erik
  • 6,909
  • 20
  • 48
  • My understanding is that you wouldn't _always_ standardize before doing PCA (you always subtract the mean however). If, for example you were trying to model salaries of different occupations and you cared primarily about the \$ accuracy of approximating with a reduced set of components you might not standardize, choosing to accept higher relative errors on low salaries. OTOH if the variables are on different scales you'd always standardize. Discussed e.g. [here](http://stats.stackexchange.com/questions/62677/covariance-v-correlation-based-pca-theoretical-view/62699#62699) in more detail. – TooTone Mar 18 '14 at 21:27
  • Standardization when performing PCA on the correlation matrix (the usual approach, outside of a few fields, like morphometrics, where they use the covariance matrix) is irrelevant: cor$(\mathbf{X})$ = cor$((a\mathbf{X})+b)$ for $0 < a < \infty$, and $-\infty < b < \infty$. Covariance matrix applications of PCA entail more than simply standardizing variables, since the assumption about what each component contributes to total variance is substantively different. – Alexis Apr 24 '14 at 14:36
0

The post referred to by whuber is quite useful for artificial data. Here's a simple PCA with your random data generated in R. The first two principal components explain about 40% of the variation, the remaining six explain the rest.

n=100
sensex.dat = matrix(NA,nrow=n,ncol=8)
sensex.dat[,1:2] = runif(n*2,4,5)
sensex.dat[,3:8] = runif(n*6,1,3)

p = princomp(sensex.dat,scale.=FALSE)
summary(p)
biplot(p,xlabs=c(rep('+',n)))
screeplot(p)

enter image description here enter image description here

mrbcuda
  • 501
  • 3
  • 5