Is variance really something useful? Or is it just a byproduct or middle step to get to standard deviation by squaring the distance of each point to the mean because it was computationally/mathematically harder to take the absolute value of the distance in the past when then didn't have computers yet?
-
6Many answers here: https://mathoverflow.net/questions/1048/why-is-it-so-cool-to-square-numbers-in-terms-of-finding-the-standard-deviation/1092#1092 – Alex R. Jun 28 '18 at 17:21
-
7Taking absolute values was never difficult before computers (modern sense) were available. Any person computing by hand could just ignore negative signs. I remember doing it! In the 19th century probable error was often computed this way: there I am guessing, not remembering. That aside, how best to measure variability was never really about how easy it was to compute a measure. – Nick Cox Jun 28 '18 at 17:33
-
7The standard deviation shows up as being the *unique* relevant estimate of spread of data or a distribution when one considers the [Central Limit Theorem](https://stats.stackexchange.com/a/3904/919). Among all possible ways of re-expressing the standard deviation one might consider, the additivity of the variance suffices to demonstrate its utility and importance. – whuber Jun 28 '18 at 17:46
-
3Yes, it is really a thing. – Mark L. Stone Jun 28 '18 at 19:02
-
1The mean squared error, ${\sigma_2}^2$, is extremely popular. But actually, in the past they used more often the mean absolute deviation, $\sigma_1$, (and other alternative measures) than nowadays. Except for useful mathematical properties (e.g. additivity) you also have, in the case of estimating the deviance parameter of the normal distribution that "The whole of the information respecting $\sigma$, which a sample provides, is summed up in the value $\sigma_2$" (see https://academic.oup.com/mnras/article/80/8/758/1063878). – Sextus Empiricus Jun 28 '18 at 20:27
-
That property relates to the spherical shape of the *normal distribution*. But, it is not universal. For example, in the case of a Laplace distribution then the mean absolute deviation is a more efficient estimator. In practice one may often encounter distributions that are not really normal distributions and the mean absolute deviation may be more robust for such variations from the ideally supposed distribution. The "superiority" (in the sense efficiency) of the mean squared error is more based on a mathematical model, which may not necessarily reflect the true nature of certain experiments. – Sextus Empiricus Jun 28 '18 at 20:33
-
I actually start to get confused now. What do you mean by *"harder to take the absolute value of the distance"*. Do you mean this in the sense of the cost function in regression being easier to minimize when you use squares? How do you otherwise see taking the absolute value as a difficult operation? – Sextus Empiricus Jun 28 '18 at 20:43
-
Variance has a number of important properties that make it useful in its own right. For example, consider https://en.wikipedia.org/wiki/Variance#Basic_properties and https://stats.stackexchange.com/questions/160427/partitioning-of-variance and https://stats.stackexchange.com/questions/133149/why-is-variance-instead-of-standard-deviation-the-default-measure-of-informati – Glen_b Jun 28 '18 at 23:28
1 Answers
Some advantages of the sample variance $S^2 = \frac{1}{n-1}\sum_{i=1}^n (X_i - \bar X)^2:$
(1) For a population with variance $\sigma^2,$ the sample variance is an unbiased estimator, $E(S^2) = \sigma^2.$
(2) For a sample from $\mathsf{Norm}(\mu, \sigma),$ one can show that $\frac{(n-1)S^2}{\sigma^2} \sim \mathsf{Chisq}(n-1),$ the chi-squared distribution with $n-1$ degrees of freedom. Thus, a 95% confidence interval for $\sigma^2$ is of the form $\left(\frac{(n-1)S^2}{U},\, \frac{(n-1)S^2}{U}\right),$ where $L$ and $U$ cut 2.5% of the probability from the lower and upper tails, respectively, of $\mathsf{Chisq}(n-1).$
(3) If you know the sample size $n,$ sample mean $\bar X,$ and variance $S^2$ of two separate samples, you can use that information to find the sample size, mean, and variance of the combined sample; similarly, for combining more than two samples. The computation for the variance involves some algebra with repeated use of the alternative formula $(n-1)S^2 = \sum_i X_i^2 - n\bar X^2.$
In some circumstances, a disadvantage of the sample variance is that its value is greatly influenced by high outliers. For example, consider the following data with $S_x^2 = 85.03.$ (Computations in R statistical software.)
x
 [1] 30.10 34.02 39.87 40.31 41.66 42.74 44.61 45.32 46.82 47.09
[11] 48.55 49.03 49.15 52.03 52.85 56.86 58.28 60.06 61.81 66.04
var(x)
[1] 85.02517
If the largest observation were 96.04 (say, due to data entry error or equipment failure), the variance would be 185.86.$
y = x; y[20] = 96.04; y
 [1] 30.10 34.02 39.87 40.31 41.66 42.74 44.61 45.32 46.82 47.09
[11] 48.55 49.03 49.15 52.03 52.85 56.86 58.28 60.06 61.81 96.04
var(y)
[1] 185.8567
By contrast, another way to measure variability is to take the difference between the upper and lower quartiles. This difference is called the 'interquartile range' (IQR). The IQR is the same (11.38) for both versions of the data.
summary(x); IQR(x)
   Min. 1st Qu.  Median    Mean 3rd Qu.    Max.
  30.10   42.47   47.82   48.36   53.85   66.04
[1] 11.3825
summary(y); IQR(y)
   Min. 1st Qu.  Median    Mean 3rd Qu.    Max.
  30.10   42.47   47.82   49.86   53.85   96.04
[1] 11.3825
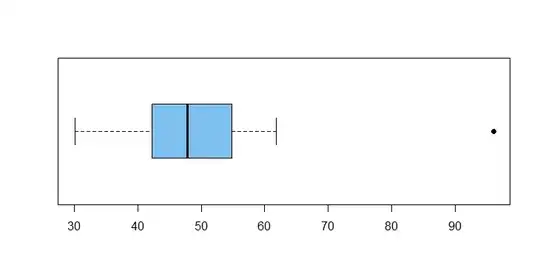
The IQR is sometimes used in boxplots to call attention to outliers in data.
boxplot(y, col="skyblue2", pch=19, horizontal=T)
In this boxplot of the data y, observation 96.04 is plotted separately
(as an outlier) because it lies beyond a 'fence' (not shown) located 1.5(IQR) above the upper quartile 53.85;
that is, $96.04 > 53.85 + 1.5(11.38) = 70.92.$
Note: If you know the sample size, sample median, and IQR of two separate samples, you cannot generally use that information to find the median or IQR of the two samples combined.
- 47,896
- 2
- 28
- 76
