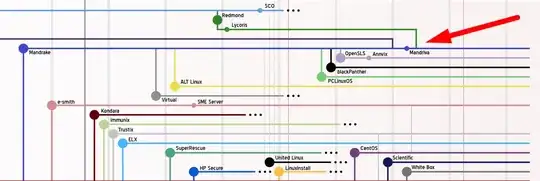
I have a series of mergers and spinoffs that can be represent a timeseries graph or tree that will split and sometimes recombine over time. I'm looking to understand what this type of graph might be called or if there's even a standard term and/or some possibilities of what tools might be utilized in such a visualization. I've seen some similar graphs called dendrograms in a very similar question (and another question), but I haven't run across the ability for a set of lines on a timeline to merge back into lines after they split. Does this type of graph have a more technical name? What tools are used for representing this kind of data?
Below is an small clip of a Linux timeline from this page demonstrating this particular feature.
