3

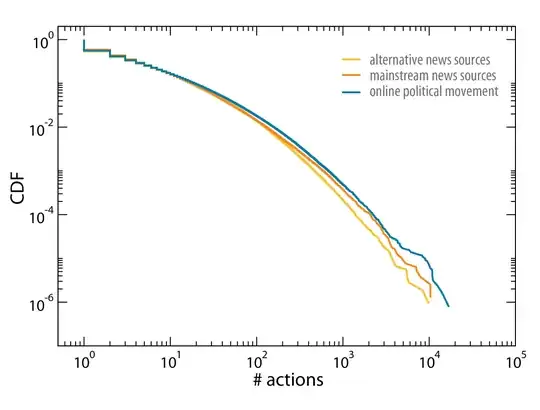
I'm trying to understand the meaning of this graph, which is a CDF (Cumulative Distribution Function). But I can't.

Why is it starting from the top-left corner? I've never found such a graph.

And what's the meaning of this function? Does it mean: #actions are less than 10^0 always?

My CDF

EDIT

I've got another problem. As you can see in this image, the probability in the y-axis goes beyond 1 (in fact it's 10^2). How is it possible?

My PDF

  • 3
    This is the sort of plot that power-law proponents like to claim as a good fit and power-law sceptics like to regard as another failure of an oversold model, given the systematic curvature for all subsets. Note that _proponent_ is not a typo for _exponent_. – Nick Cox Jun 18 '18 at 18:13
  • 1
    Regarding your edit, I believe it is answered here: https://stats.stackexchange.com/questions/4220/can-a-probability-distribution-value-exceeding-1-be-ok If the link does not answer your question, it seems that you might have a **new** question; please use the Ask a Question button to ask a new question. – Sycorax Jun 18 '18 at 20:56
  • The second graph is (as it says) showing a PDF, meaning probability density function. It's related but quite different, as velocity graph corresponds to a graph of distance travelled (or in your course distance to travel). – Nick Cox Jun 18 '18 at 21:09
  • Found the answer here: https://www.quora.com/How-does-one-interpret-probability-density-greater-than-one-What-is-the-physical-significance-of-probability-density-Is-it-just-a-mathematical-tool – Francesco Andreuzzi Jun 18 '18 at 21:11
  • I didn't know that there wasn't a "direct" way to interpret a PDF, like it is with a CDF (I mean, CDF can be read like a sequence of P(x,y), right?). The only way to read a PDF is with a definite integral, so the probability is not in the y-axis, but it's the area inside the interval (which you can with the integral). Please correct me if I'm wrong – Francesco Andreuzzi Jun 18 '18 at 21:14
  • Your second graph is a density graph with log-scales. Densities do not have to be less than $1$, though they do have to integrate to $1$ - note that the density is above $1$ only up to about $10^{-1}=0.1$ so this may not be a problem – Henry Jun 18 '18 at 22:31

1 Answers1

11

Why is it starting from the top-left corner?

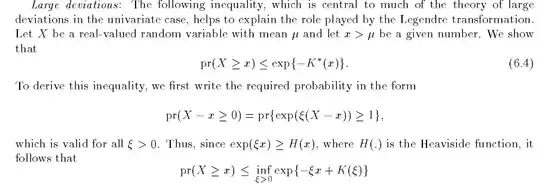
The standard* definition of a CDF is $$ F_X(x) := \mathbb{P}(X \le x) $$

For reasons which I will never understand, some people plot $S(x) = 1 - F_X(x)$ for $F_X(x)$ the CDF of $X$, but call $S$ the CDF. It is completely baffling if you were taught that the CDF is non-decreasing.

As with all conventions, it's no so much a matter of being right or wrong as it is being clear in your communication: if you're going to use a term in a specialized or unusual way, you should make that clear. (And we can surmise that, since you are asking this question, the authors of that diagram did not make their meaning clear.)

I've only seen $S$ called a CDF in papers like "Power-Law Distributions in Empirical Data." This paper specifically has some rather prominent authors (Aaron Clauset, Cosma Rohilla Shalizi, and M. E. J. Newman). Nick Cox is probably correct that choosing to call $S$ the CDF is purely related to the convenience of computing and plotting logarithms.

And what's the meaning of this function?

The function $S$ is more conventionally known as a "survival function" and it reports $\mathbb{P}(X > x)$, i.e. the complement of what everyone else calls a CDF.


*One of my professors remarked that there was a standard in Russia/USSR to use the definition $F_X(x) := \mathbb{P}(X < x)$, but that it never had much usage outside of the Eastern Bloc. I can't say that I'm familiar enough with Soviet probability texts to comment either way.
Sycorax
  • 76,417
  • 20
  • 189
  • 313
  • Thank you! So, if I understood properly, the y-axis is not the probability, but (1 - probability)? – Francesco Andreuzzi Jun 18 '18 at 17:48
  • @FrancescoAndreuzzi It depends on which probability you are referring to. You need to be precise about which event you are considering. – Sycorax Jun 18 '18 at 17:48
  • I meant the probability that X is less than or equal the value in the x-axis – Francesco Andreuzzi Jun 18 '18 at 17:50
  • 1
    The vertical axis shows the probability of observing a value larger than the value on the horizontal axis. – Sycorax Jun 18 '18 at 17:51
  • Yeah, I got it. But a common CDF tells the probability of observing a lower than or equal value. Thank you very much – Francesco Andreuzzi Jun 18 '18 at 17:52
  • 4
    Other names I have met (apart from survival function) are converse or complementary distribution function, reliability function, and survivor function. Think about the number of classmates from school still alive over several years (melancholy example for those in middle age or later), the number of light bulbs still working after so many hours, the number of asteroids that are this big or bigger, etc. – Nick Cox Jun 18 '18 at 18:06
  • Old joke: The great thing about standards is that there are so many to choose from. The definition you give strikes me as more common in what I've read but there are subtle arguments (or stylistic preferences) for $P(X < x)$. One such is that log of 1 $-$ that is always positive with real data. – Nick Cox Jun 18 '18 at 18:10
  • @NickCox That's a good point -- reminded me of a peculiar anecdote which I've added to my answer. – Sycorax Jun 18 '18 at 18:12
  • Survival functions are utterly standard in biostatistics (medical statistics), for lives of people, rats, implants, etc.) and in many industrial problems (survival of manufactured items). – Nick Cox Jun 18 '18 at 18:17
  • @NickCox I don't object to having a special name for the complement of the CDF. I only object to having conflicting names. – Sycorax Jun 18 '18 at 18:18
  • Depends on who taught you. I too learned cumulating as lowest values first. But both are cumulative; it is just a matter of convention on which order to take values in. Ranking raises exactly the same issue. Order statistics start at the minimum but for field events we always rank the other way. (Ever noticed that track events have lowest performance as best and field events have highest performance as best. Perhaps that's too obvious to point out but when I was searching in 1999 for standard names for these kinds of ranking I couldn't find any and suggested track and field.) – Nick Cox Jun 18 '18 at 18:26