2

I have a dataset which has the following two tables which look like the following:

District ID Crime Rate Violent Crime Rate   Annual Police Funding
97  437 148 36
96  819 369 30
83  799 693 35
81  548 226 31
74  432 98  23
71  989 1375 22
68  494 213 32

and

District ID     % of People 25 Years+ with 4 or more Years of High School   % of 16 to 19 year-olds not in highschool and not highschool graduates  % of 18 to 24 year-olds in college  % of people 25 years+ with at least 4 years of college
1   69  23  7   12
2   80  10  7   15
3   77  8   7   12
4   57  11  7   17
5   72  22  8   26
6   55  5   9   29

The problem states: 2. How big of a role does police funding play in reduction of crime compared to other demographic factors? Do they overlap?

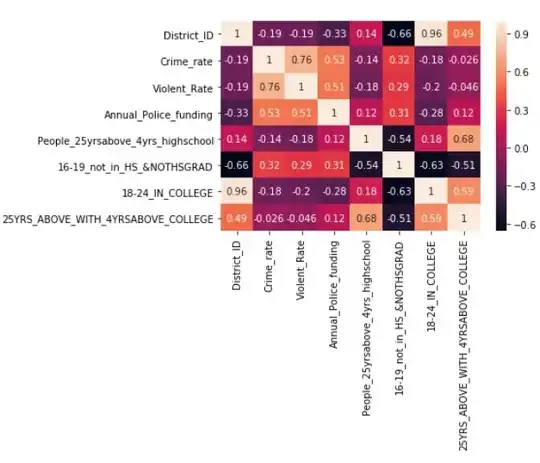
I started with correlating all attributes and don't see significant correlation of crime rate with the police funding. correlation.
What other statistical tests can be performed to come to good conclusions?

2 Answers2

3

Premise: I agree with Denwid that you should look at scatterplot rather than only at correlation coefficients.

Some reflections: the original problem asks to investigate the role of police funding in reducing crime, compared to other demographic factors. As you can see from the correlation table, police funding is positively correlated with crime rate, meaning that an increase in police funding corresponds to an increase in crime rate, which counters our intuition. This statistical conundrum is a very common one and arises whenever there is a confounding variable: in this case, it seems to me that the confounding variable is violence rate - areas with high violence rate have higher reported crime rates, and police in those areas is better funded than "calm" areas in order to face the higher demand. So a two-way correlation approach would fail to identify the role of police funding in reducing crime rates.

What I would do: In order to investigate the contribution of police funding to reducing crime rates, I would fit a generalized linear model (with logistic link if crime rate is bounded between 0 and 1) with police funding as explanatory variable and crime rate as outcome variable, adjusting$^1$ for violence rate (that is, including violence rate in the explanatory variables). If police funding is continuous, I would model it with a cubic spline (possibly transforming it first to $log_{10}$ if its distribution ranges several orders of magnitude). I would also model violence rate with a spline. I would then look at the partial effects plot to investigate the relationship between police funding and crime rate, adjusted by violence rate.

It is unclear to me, though, how to compare the "effect" of police funding with the "effect" of demographic factors. I welcome suggestions!


Footnotes

  1. Should there be an interaction between police funding and violence rate?
0
  • When looking at one-to-one variable relationships, you should always have a look at the scatterplot, in this case e.g. plot Police Funding on X-Axis and crime rate on Y-Axis. Then also look at the same plot for the other demographic factors. This will give you a better picture of the "true" situation than a simple correlation coefficient.
  • Look at other correlation coefficients. By default people usually look at Pearson product-moment correlation coefficient but depending on the data a rank correlation coefficient might also yield interesting results.
  • More advanced techniques can be used when you start applying more advanced models. For example one could fit a decision tree to predict the crime-rate and then look at the feature importances of the tree. Even past that, the whole domain of model interpretability is looking into relationships models learned from the data and how we can make them visible.
Denwid
  • 702
  • 5
  • 14