Python matplotlib has a boxplot command.
Normally, all the parts of the graph are numerically ticked. How can I change the ticks to names instead of positions?
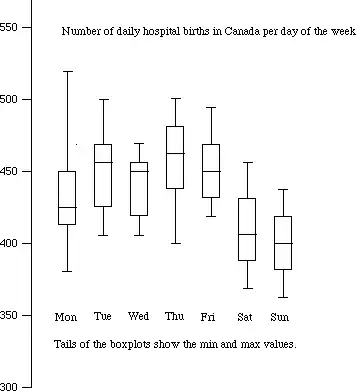
For illustration, I mean the Mon Tue Wed labels like in this boxplot:
Python matplotlib has a boxplot command.
Normally, all the parts of the graph are numerically ticked. How can I change the ticks to names instead of positions?
For illustration, I mean the Mon Tue Wed labels like in this boxplot:
Use the second argument of xticks to set the labels:
import numpy as np
import matplotlib.pyplot as plt

data = [[np.random.rand(100)] for i in range(3)]
plt.boxplot(data)
plt.xticks([1, 2, 3], ['mon', 'tue', 'wed'])
edited to remove pylab bc pylab is a convenience module that bulk imports matplotlib.pyplot (for plotting) and numpy (for mathematics and working with arrays) in a single name space. Although many examples use pylab, it is no longer recommended.
ars has the right, and succinct answer. I'll add that when learning how to use matplotlib, I found the thumbnail gallery to be really useful for finding relevant code and examples. For your case, I submitted this boxplot example that shows you other functionality that could be useful (like rotating the tick mark text, adding upper Y-axis tick marks and labels, adding color to the boxes, etc.)