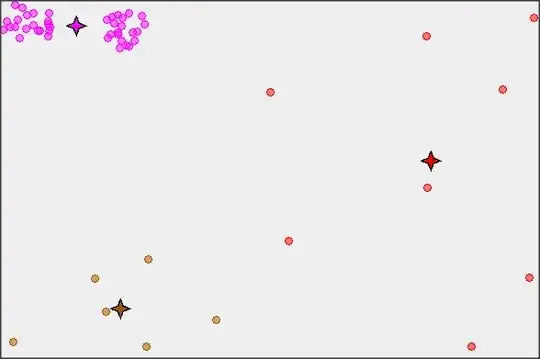
Congratulations, with this question you had me nerd-sniped.
My interpretation of your question regarding "tightness" of the cluster is that you are interested in measuring whether the dispersion is the same between the two samples, i.e. if their covariance matrices $\Sigma_{left}$ and $\Sigma_{right}$ are the same. As it turns out, this is a nontrivial topic with a number of caveats, which can be addressed in various ways:
1. In general, most readily available literature makes certain assumptions about the samples before proceeding to the testing, the most common assumption being the samples follow a multivariate normal distribution. If you can test and not reject the hypotheses that both your samples are from a bivariate normal distribution (regardless of their estimated mean vectors and covariance matrices $\hat{\mu}$ and $\hat{\Sigma}$), then you can use Box's M-test or a variety of other likelihood ratio (LR) tests that check for the relationship between $\Sigma_{left}$ and $\Sigma_{right}$. A simple search will give you a plethora of ways to go about it, and a starting point could be an article called Visualizing tests for equality of covariance matrices as well as another one called A robust testing procedure for the equality of covariance matrices. The latter one also shows how you can use Monte Carlo methods if you want a non-parametric approach.
2. For the case where the distributions are not $\mathcal{N}_2(\mu,\Sigma)$, it gets a bit more complicated. Two suggestions that come to mind are: a) a two-sample, two-dimensional Kolmogorov-Smirnov test that will check if the two bivariate distributions are equal to each other, and b) checking whether the dependence structures of the two samples are the same by calculating their empirical copulas and performing a simulation test.
a) You can find the details for this test in a paper called Two-dimensional goodness-of-fit testing in astronomy. The drawback here is that this will test for the equality of the distributions in whole, which is a stronger approach than just checking for the covariance matrices since it also looks at the locations, i.e. the mean vectors $\mu_{left}$ and $\mu_{right}$. However, if you know beforehand (by design of the mechanism that produced your data or via some other way) that your data should have the same location in both cases, then this test could answer your question.
b) The copula method might be a bit of an overkill since it will require quite a bit of coding work, but it has the benefit that it is non-parametric, meaning it does not make any assumptions on the distribution of the data (even though you don't seem to have extreme observations in your samples if judging by your graphs, the KS test does place higher importance to the center of the distribution and is not as sensitive to the "outliers", which might affect the result). The copula you estimate for each of the 2-d samples will contain all the information on the dependence structure between the individual $(X,Y)$, and you can test whether those dependence structures are the same by using the methodology described in this great article called Testing for equality between two copulas. It is noteworthy that the result here is achieved via simulation, which I personally find to have an extra educational effect, making the concept of statistical testing more easily understood.
Lastly, check this great post here on Cross Validated which addresses this very same topic, but will a lot more info than I provide. Hope this helps.
