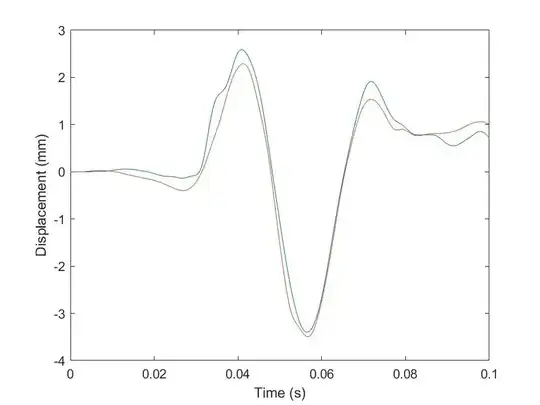
I am working on a project comparing the accuracy of two imaging techniques to measure displacement. I have attached a graph comparing the displacement measured by both techniques over time.
I am looking for a method to quantify the similarity of these two plots, preferably using Matlab. I have tried the 2-sample Kolmogorov–Smirnov which was unsuccessful. I have also tried cross-correlation which gives a strong positive correlation between the two plots however as the data is non-stationary I believe this could be over-stated due to auto-correlation.
My current solution is to use Spearman's rank to show similarity in magnitudes of the plots partnered with RMS error to show that they are in phase. However, I do not believe this would be a 'proper' way to achieve my goal. Is there a more appropriate statistical test I can use to quantify similarity of these plots of the two imaging techniques?
