4

I'm hitting an issue with a causal impact model that I'm building.

I'm trying to create a counter factual for daily sales at one store (nseasons = 7). I've included sales for 5 other stores nearby. Eyeballing a lineplot, it appears to me that trends are similar across the 15 month period.
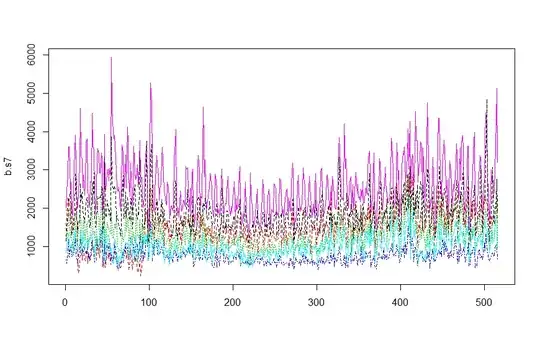
line plot

When I run my causal impact model, the CI bands are really wide.
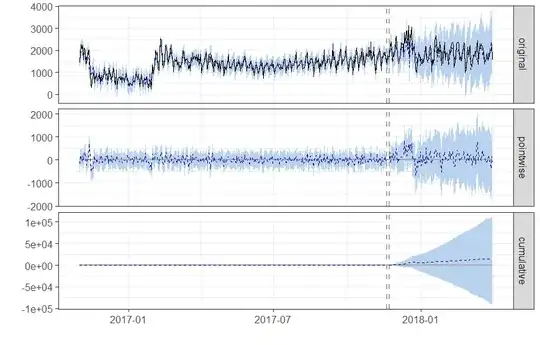
Causal Impact Model

Any recommendations on what I can do to reduce the CI? Anything apart from adding more time series to the model? How big an issue is it to have wide CI in a Bayesian model (i.e. credible versus confidence)?

Here is the code:

CausalImpact(sales, pre.period, post.period, 
             model.args = list(niter = 1000, nseasons = 7))

Any direction would be greatly appreciated!

kjetil b halvorsen
  • 63,378
  • 26
  • 142
  • 467
adrianf22
  • 41
  • 1

1 Answers1

2

The line plot shows that the scale of daily sales differ by almost an order of magnitude; so log-transforming daily sales and working on a log scale could help to get better models (it's easier for CausalImpact to fit a model if the variability of all control time series is of the same order of magnitude).

In addition, the training period (pre-intervention period) is rather long. This is fine as long as the whole training period is predictive for the post-intervention period, but there might be different factors influencing sales over the course of a year. Maybe try to fit the model on a shorter pre-intervention period (keeping only the last, say, 3 to 6 months before the intervention).

Overall, the fact that credible bands are widening quickly shows that CausalImpact currently fits a strong random walk component, which means the variability in the response is currently not well explained by the course of the control time series.

Alain Hauser
  • 191
  • 4
  • Thanks so much for the response Alain! It was really helpful. Reducing the pre-period helped tighten up the bounds considerably. – adrianf22 Apr 16 '18 at 09:28