2

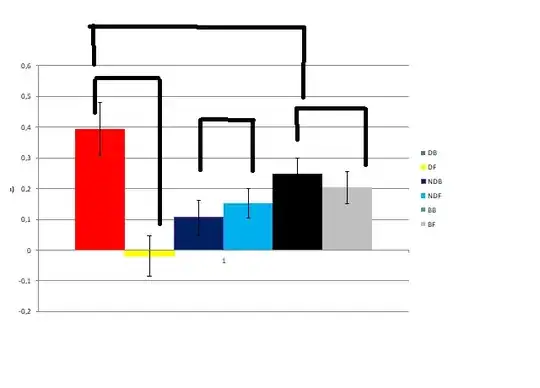
I´ve run a GLMM model with the following variables: Response variable: continuous (with positive, negative and zero values; Explanatory variable: 1 factor with 6 levels (DB, DF, NDB, NDF, BB, BF); individual as a random effect variable

After running a lmer function, and checking the assumptions, I want to perform a posteriori specific comparisons. How do I do that? I want to test for example if there is any difference between DF vs. DB. How do I write this in R??

CODE IS AS FOLLOWS

#Model:
m1 <- lmer(Vueltasmin ~ Condicion + (1 | Bicho), Datos)
summary(m1)

#Checking asusmptions: OK 

#Comparisons:
model.matrix.gls <- function(object, ...) {
  model.matrix(terms(object), data = getData(object), ...)
}
model.frame.gls <- function(object, ...) {
model.frame(formula(object), data = getData(object), ...)
}
terms.gls <- function(object, ...) {
  terms(model.frame(object), ...)
}


#Comparisons desired:
#DB-DF
#NDB-NDF
#BB-BF
#DB-BB

Here I show how the data plot looks like, and the comparisons desired. enter image description here
Thanks everyone for the help provided!

ybarnatan
  • 121
  • 7
  • Check out https://stats.stackexchange.com/questions/237512/how-to-perform-post-hoc-test-on-lmer-model. And then google "lsmeans", there are several good tutorials out there. – deasmhumnha Apr 06 '18 at 05:30
  • Hi Dezmond Goff, I reviewed the link you posted, but that's for multiple comparisons and I want to perform specific ones – ybarnatan Apr 06 '18 at 14:38
  • This is why I also suggested you look at a tutorial of lsmeans as there are ways to specify exactly what contrasts you are interested in. https://www.google.com/url?sa=t&source=web&rct=j&url=https://cran.r-project.org/web/packages/lsmeans/vignettes/using-lsmeans.pdf&ved=2ahUKEwjsmtiFsKbaAhUHqlQKHWNHB-IQFjAAegQIBxAB&usg=AOvVaw2kxQsw-sISiXmxlP2kTzj4 – deasmhumnha Apr 06 '18 at 19:30
  • Hello Dezmond, thanks again. I don't quite understand the syntaxis of lsmeans, could you please tell me what should I type or how to adapt the example they give to mine? Thanks! – ybarnatan Apr 07 '18 at 17:03

2 Answers2

1

Please look at the documentation for emmeans::contrast; it provides for such comparisons:

library("emmeans")
emm <- emmeans(m1, "Condicion")
contrast(emm, list(
    `DB-DF` = c(-1,1,0,0,0,0),
    `NDB-NDF` = c(0,0,-1,0,0,0),
    `BB-BF` = c(0,0,0,0,-1,1),
    `DB-BB` = c(-1,0,0,0,1,0)
))

Note: This is based on the assumption that the levels of Condicion are in the order given in the question. If they are not, then they are probably in alphabetical order (the default) and you need to either permute the 1s and -1s accordingly, or create

Datos$Condicion <- factor(as.character(Datos$Condicion),
    levels = c("DB", "DF", "NDB", "NDF", "BB", "BF"))

and then re-fit the model before using the above code to obtain the comparisons.

Russ Lenth
  • 15,161
  • 20
  • 53
  • Dear rlv, thanks for your comment. I have two questions: trying to understand the syntaxis of emmeans, do you assign 1 and -1 to the pair of factor´s level you wish to compare? if so, shouldn´t be this comparison `NDB-NDF` = c(0,0,-1,0,0,0) written as `NDB-NDF` = c(0,0,-1,1,0,0) ? does it matter who is 1 and who -1? The other question is about the order of the levels: they are categorical levels, they don´t have any order. I think I didn´t quite understand what you meant. Thanks in advance for your replay!! – ybarnatan Apr 09 '18 at 23:48
  • BTW, you might want to add something like `adjust = “mvt”` so the P values are adjusted for multiplicity. – Russ Lenth Apr 09 '18 at 23:51
  • I see, I added the adjustment for multiplicity. I also see that the coefficients you posted are an outcome of coef(pairs(emm)) function. Regarding the order of the levels, that's still unclear. – ybarnatan Apr 10 '18 at 00:34
  • They are coefficients to apply; so `c(1,-1,0,0,0,0)` means 1 times the first level plu -1 times the second level plus zero times the others - thus the first minus the second. To see the order of the levels, list `emm`. You need to move the 1s and -1s around accordingly. That’s what I was trying to say in my answer. – Russ Lenth Apr 10 '18 at 00:55
0

Here is a small vignette. Note the lsmeans package has been deprecated in favor of the emmeans package, but they have very similar syntax for this simple example.

require(lme4)
require(emmeans)

N <- 1000
M <- 200
Condicion <- as.factor(sample(1:6, 1000, replace=T))
X <- model.matrix(~Condicion)
Bicho <- as.factor(sample(rep(1:200, each=5), 1000, replace=F))
Z <- model.matrix(~Bicho+0)
Vueltasmin <- X %*% matrix(rnorm(6, 0, 5), nrow=6, ncol=1) + Z %*% matrix(rnorm(M, 0, 10), nrow=M, ncol=1) + rnorm(1000, 0, 1)

mod <- lmer(Vueltasmin ~ Condicion + (1 | Bicho))
summary(mod)

mod.emm <- emmeans(mod, "Condicion")
mod.pair <- pairs(mod.emm)
mod.comp <- mod.pair[c(1, 4, 10, 15)]
mod.comp

They key is that after you call pairs on the emmobj, you index for the contrasts of interest (in your case, 1, 4, 10 and 15). The p-values are then readjusted for the smaller number of comparisons.

deasmhumnha
  • 849
  • 4
  • 9
  • Dear Dezmond Goff, thanks for the example! I´m trying my best to look for information on what every line means, because I have a limited understanding about R coding. – ybarnatan Apr 09 '18 at 23:58
  • The first section is just generating fake data according to the specification of a LMM. Only the last 4 lines after model fitting are important. – deasmhumnha Apr 10 '18 at 00:06