I am fetching trending topics from social media where the frequency of likes is said to follow a Zipf-Mandelbrot distribution; i.e., some of the posts will have a high number of likes and some other very few.
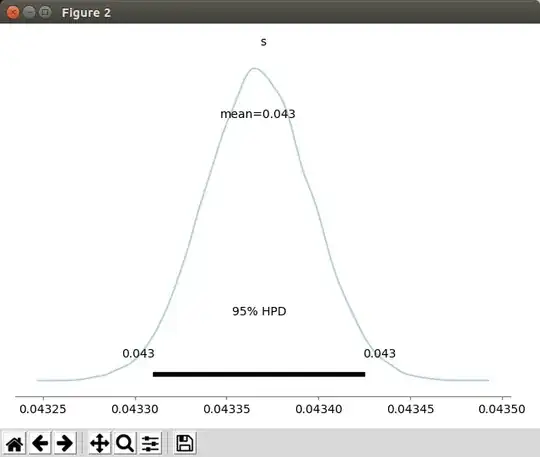
So far I collected about 100 thousand samples and I want to calculate the s and q parameters. I looked at the script described here. I ran the code on my data and it gives me the s parameter of s=0.043.
How do I calculate q?
The first figure is from the Python Powerlaw package.
PS: I'm a statistics newbie
The script in the answer generated the following warnings:
Warning messages:
1: In nlm(function(p) negloglik(p, x = x), p = c(20, 20)) :
  NA/Inf replaced by maximum positive value
2: In nlm(function(p) negloglik(p, x = x), p = c(20, 20)) :
  NA/Inf replaced by maximum positive value
3: In nlm(function(p) negloglik(p, x = x), p = c(20, 20)) :
  NA/Inf replaced by maximum positive value
and this plot:
I modified the above script to fit my data:
> N <- 40480    # the size of my dataset
> x <- read.csv("dataset.txt")    # my dataset file
> negloglik <- function(parms, x=x) {
+     H <- sum(1/(1:N + parms[1])^parms[2])
+     -sum(log(1/(x + parms[1])^parms[2]/H))
+ }
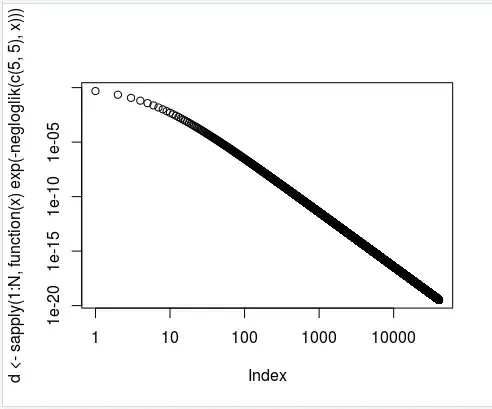
> plot(d <- sapply(1:N, function(x) exp(-negloglik(c(5,5), x))))  # here I changed 10 to N (the size of my data)
> x <- sample(1:N, 1000, replace = T, prob = d)
> ml <- nlm(function(p) negloglik(p, x=x), p=c(20,20))
This output the following graph: (xy log scale)
However, I got a similar warning message:
Warning message:
In nlm(function(p) negloglik(p, x = x), p = c(20, 20)) :
  NA/Inf replaced by maximum positive value
