2

I have a set of 3D points, which look as follows: enter image description here
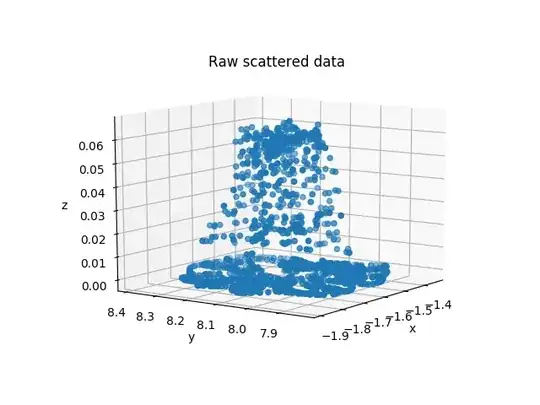
They form a shape similar to Gaussian/parabolic function or a mixture of these and my goal is to extract this shape.

I thought I could estimate parameters of a multivariate Gaussian from these points and in such way get a similar shape, however, they do not follow the normal distribution. So this is what I do to get a multivariate normal distribution from these data points.

I create a distribution of the points, where the probability for a point at (x,y) to occur is equal to z. Also, I normalize the z component, so that sum of all z components = 1. This gives me distribution which could be fed to Gaussian Mixture Model to estimate the parameters.

So I already implemented this and everything works nicely, but now I need to write it down with more theory behind and cannot figure it out.

Is it some well-known method?

How could this be modelled formally?

I was suggested to have a look at Gaussian Mixture Regression, but couldn't connect the dots.

EDIT: The x and y plane represents coordinates on a surface and z the amplitude of the sound generated at (x,y) position. The points were collected by scanning the surface with a sensor which emits sound with increasing intensity as we move towards the centre of the plot and decreases once moved away from the centre. Sample audio field could be found here.

  • 1
    It would help to explain how these points were obtained and to clarify what they mean. As illustrated and explained, you have a nonlinear regression problem ("curve fitting,") not a problem of estimating a distribution or mixture model. – whuber Mar 27 '18 at 20:11
  • @whuber Thanks for your observation, I added more info in the edit – Laurynas Tamulevičius Mar 27 '18 at 20:35
  • 1
    Thank you: that clarifies that you are fitting a *response surface* to the data. Although it could have a Gaussian shape (the graphic suggests that would be a poor fit), this is decidedly not a distribution-fitting problem. The apparent mathematical similarities may be leading you astray. – whuber Mar 27 '18 at 21:37
  • @whuber Hmm, I understand that the points do not represent the distribution but I thought I could convert them to a distribution in order to do GMM and in such way fit multivariate normal. What would be your suggestion to fit such data points? – Laurynas Tamulevičius Mar 27 '18 at 21:47
  • If you post a link to the data, I will run it through my online curve and surface fitting web site's "function finder" and see what equation it comes up with. – James Phillips Mar 27 '18 at 22:03
  • @JamesPhillips That would be great! [Here's](https://uploadfiles.io/qj95l) the link to a numpy array of the 3D points or do you prefer raw text? Thanks – Laurynas Tamulevičius Mar 27 '18 at 22:05
  • @JamesPhillips On the other hand, the plot might not necessarily look like that and could be elliptical (as it would be formed by two separated gaussian curves), hence finding a single fitting function might not be very useful – Laurynas Tamulevičius Mar 27 '18 at 22:07
  • Here is a 7.8 Mbyte 3D rotating scatterplot GIF animation of the raw data http://zunzun.com/temp/static_images/rotation.gif it appears that this dataset is unsuitable for surface fitting as the data points do not appear to lie on a surface. This may be obscured in your image by the point size, a smaller point size in the image should reveal this. – James Phillips Mar 28 '18 at 00:53
  • @James One wouldn't expect the points to lie exactly on a surface, because they represent sensor readings. At a minimum we would expect them to include Poisson-like "shot noise." This calls for something like a generalized linear model with a 2D spline, or even a nonlinear version of the GLM. – whuber Mar 28 '18 at 13:21
  • When I calibrated X-ray aluminum thickness sensors in the USA, Japan and France the sensor readings lay on a surface, at the time we were using 3D surface polynomials for the industrial gauge calibrations. That is why I thought the sensor readings might lie on a surface, and showed visually why they did not do so. – James Phillips Mar 28 '18 at 17:54
  • @JamesPhillips Thank you for your help, however, this still doesn't answer my question if my method to treat z component as mixing coefficient in GMM context makes sense. – Laurynas Tamulevičius Mar 29 '18 at 11:22
  • @whuber I am still puzzled and not convinced why I couldn't fit this surface with GMM treating z component as a mixing coefficient? – Laurynas Tamulevičius Mar 29 '18 at 11:25

0 Answers0