1

Let's say there is a die. Getting an even number has a probability of $P(even)=2/9$ for each even number and $P(odd)= 1/9$ for each odd number. Let's say that $Y = F_X(x)$. Now we wish to plot $F_Y(y)$. If $X$ was continuous, then it would be $F_Y(y) = y$, but since $X$ is discrete, $F_Y(y)$ is a step function where $F_Y(y) \le y$ for all $0 < y < 1$ and $F_Y(y) < y$ for some $0<y<1$.

$F_X(x)$ F_X

$F_Y(y)$ This is quite easy to see if plotted: F_Y
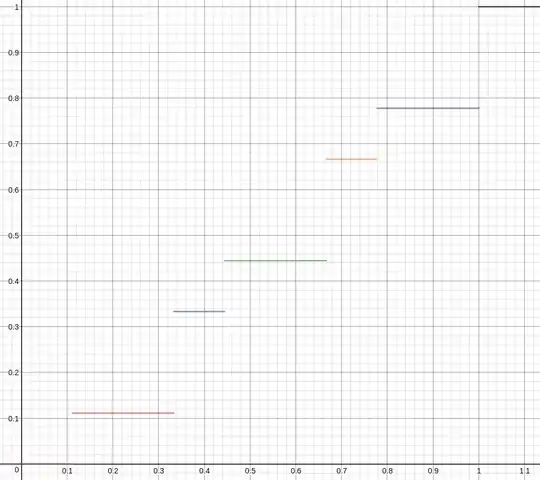
My problem is I'm not sure how to express this CDF in a mathematical way. So far I have:

$$F_Y(y) = \begin{cases} y, & \text{ if $F_X^{-1}(y) \in X$} \\ ?, & \end{cases} $$
MoneyBall
  • 737
  • 4
  • 15
  • 3
    It may just be that I have not yet caffeinated this morning, but if P(odd) = 1/9, and P(even) = 2/9, what do the other 6/9ths of the sample space represent? (Fractional values? Imaginary numbers? Something even more interesting? Those be some fancy dice!) – Alexis Mar 19 '18 at 16:15
  • 1
    @Alexis: He means to say for *each* even and for *each* odd number, so total probability must be $\frac{1+2+1+2+1+2}{9}$. – kjetil b halvorsen Mar 19 '18 at 17:59
  • @kjetilbhalvorsen Thank you. Incidentally, I think "she" not "he," given "cowgirl" in her description. – Alexis Mar 19 '18 at 18:05
  • 1
    That's not the CDF of a die! Such a CDF would have jumps only at the values shown on the die, which evidently are the numbers $1,2,3,4,5,6.$ What are you showing on the horizontal (value) axis? As far as mathematical notation for a discrete distribution function goes, one method is illustrated in my answer at https://stats.stackexchange.com/a/73626/919. – whuber Mar 19 '18 at 19:01
  • @whuber I added more images. I apologize for crappy plots, I couldn't find a good site to plot and label. The first is a cdf of X and second is a cdf of Y, $F_Y(y)$. – MoneyBall Mar 20 '18 at 00:06

0 Answers0