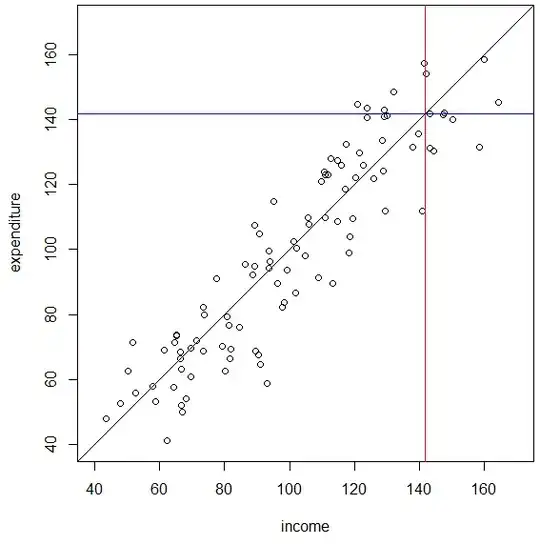
In studying the relationship between income and consumption, it is common to sort the observations by income and observe that high-income households have lower levels of consumption per dollar of income than low-income households, i.e., they have higher savings rates. This conforms to one's naive intuitions about the relationship, whether you think the higher income is the cause or consequence of the higher savings rate.
I recently took a commonly used consumption data set (the U.S. Survey of Consumer Expenditure), and sorted it into deciles based on aggregate consumption. After this sorting, the decile with the highest consumption had the lowest savings rate. In fact, they dissaved by a considerable margin.
I am looking at some real reasons why this might be true in the period in question (e.g., drawing down fictitious wealth from the housing bubble), but it seems to me that I might get the same result if income and consumption were both observed with error, that is, if the errors were not too highly correlated.
Suppose that this is true, and that the errors (or the percentage errors) of household income and consumption are uncorrelated with the true errors. How might I estimate that relationship correctly? And more specifically, can I estimate it correctly groupwise, for, e.g., income deciles or consumption deciles or quintiles? (Here I use "deciles" to refer to the groups of sample observations divided by the decile break-points, rather than by the breakpoints themselves).
