If you only look at the counts of positive and negative values then you lose a ton of information, so your test will not be powerful. That also fails to test symmetry fully, since it cannot distinguish symmetric distributions from non-symmetric distributions with equal probabilities of positive and negative outcomes.
Consequently your latter idea (for a two-sample Kolmogorov-Smirnov test comparing $\mathbf{s}$ and $-\mathbf{s}$) shows that you are thinking in the right direction. Whilst this is a good place to start, the specific test you are proposing has serious problems due to the fact that (a) it essentially "double-counts" the data; and (b) the two data vectors are not independent of each other. Below I will show that this leads to a non-uniform p-value under the null hypothesis. To do this, let's first program your proposed test in R. (I've added a few bells and whistles using the general methods set out here.)
symmetry.test <- function(x, median = 0, exact = NULL, ...) {

  #Get data information
  DATA.NAME <- deparse(substitute(x))
  xx <- x-median
  n <- length(x)

  #Implement KS test
  TEST <- ks.test(x = -xx, y = xx, alternative = 'two.sided', exact = exact, ...)
  TEST$method      <- 'Symmetry test using KS test for magnitudes of sub-samples'
  TEST$alternative <- paste0('Sampling distribution is not symmetric around ',
                             round(median, 4))
  TEST$data.name   <- paste0('Sample vector ', DATA.NAME, ' containing ', n, ' values')

  TEST }
Now, let's try implementing this on a symmetric distribution (e.g., the standard normal distribution) and look at the resulting distribution of the p-value. I will do this by simulating $M=10^6$ random samples of size $n=100$ and computing the p-value of your test. As you can see from the histogram below, the p-value for the test is not uniform in this case.
#Set parameters for simulation
n <- 100
M <- 10^6

#Simulate p-values from the test (with symmetric distribution)
set.seed(1)
PVALS <- rep(0, M)
for (i in 1:M) {
  DATA <- rnorm(100)
  TEST <- symmetry.test(DATA)
  PVALS[i] <- TEST$p.value }

#Show histogram of p-values
hist(PVALS, xlim = c(0,1), breaks = (0:100)/100, freq = FALSE, col = 'blue',
     main = 'Simulation of p-value from proposed test',
     xlab = 'p-value', ylab = 'Density')
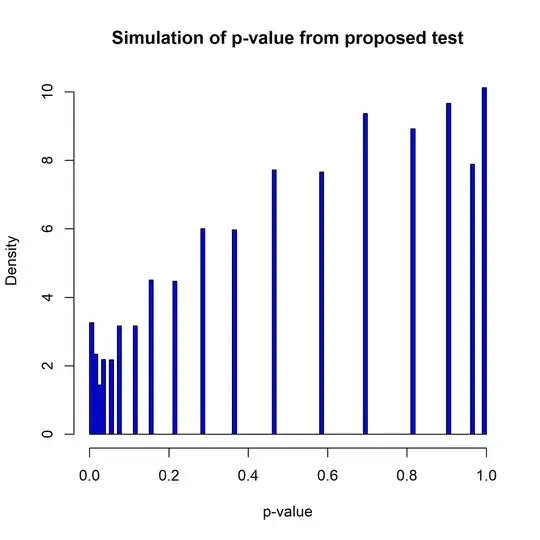
So, unfortunately your proposed test doesn't really work. If might be possible to salvage it my modifying the test somehow to take account of the deviations from standard assumptions. As a starting point, I'd suggest that it might be better to do a two-sample test comparing the vectors $\mathbf{s}_-$ and $\mathbf{s}_+$ defined by $s_i^- \equiv \max(0, -s_i)$ and $s_i^+ \equiv \max(0, s_i)$. That would ameliorate the problem of "double-counting" the data and it would greatly lessen the statistical dependence between the two vectors. Since these data vectors are "censored" you would need some non-parametric test that can handle censored data (the standard KS-test is not built for this case). If you were to develop the test in that direction, you might be able to build one that gives a uniform p-value for symmetric distributions.
Of course, as a final observation, you could just use one of the standard symmetry tests in the statistical literature for the case where the median is unknown. That is the standard case of interest in the literature, and there are many existing tests that have been developed. There is a slight loss of power from failing to use the known median in your problem, but it should not make too much difference once you have a decent amount of data.
