I'm not sure the data you added to your post is the same you used to make the plot. At any rate, it doesn't really matter since we're trying to help with the
underlying methodological aspect of the problem.
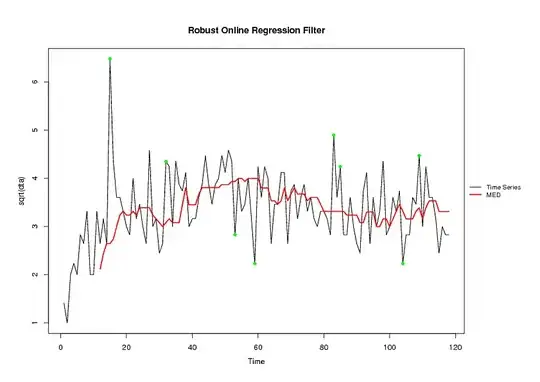
From whatever information we have, i would advise a simple median filter:
The idea is to circumvent the model-fitting procedure as much as possible, since we don't have enough information --and IMHO datapoints-- to build a complicated model.
Edit: Following Whuber's suggestion I've taken the square root transformation to symmetricize the residuals.
looking at the outliers, i don't really see a seasonality --below, for illustration, i'm carrying the analysis using R, the open source statistical software
library("robfilter")
dta<-c(2, 1, 4, 5, 4, 8, 7, 11, 4, 4, 11, 7, 10, 7, 42, 19, 13, 13, 11, 9, 8, 16, 10, 12, 9, 7, 21, 9, 10, 6, 7, 19, 18, 9, 19 ,15, 14, 17, 9, 10 ,10, 13, 15, 20, 15, 12, 15, 16 ,20, 17, 21 ,19, 8, 16, 11, 12, 16, 10, 5, 18, 13, 18, 16, 7, 12, 12, 17, 17, 7, 14, 15 ,10, 13, 15, 11, 13, 10, 9, 11, 11 ,10, 8, 24, 13, 18, 8, 8 ,13, 9 ,7, 6, 14, 17 ,7, 13, 9, 11, 19, 8 ,9, 13, 11, 14, 5, 8, 8, 13, 12 ,20, 9, 18 ,13, 13, 10 ,6 ,9, 8, 8)
mod4a<-robreg.filter(y=sqrt(dta),width=12,method="MED",h=7,minNonNAs=5,online=TRUE,extrapolate=FALSE)
resds<-abs(c(rep(sqrt(dta[1]),11),na.omit(mod4a$level[,1]))-sqrt(dta))
mod4b<-robreg.filter(y=resds,width=12,method="MED",h=7,minNonNAs=5,online=TRUE,extrapolate=FALSE)
otl<-which(resds/mod4b$level[,1]>3) #time of the outliers:
>otl
[1]  15  32  53  59  83  85 104 109
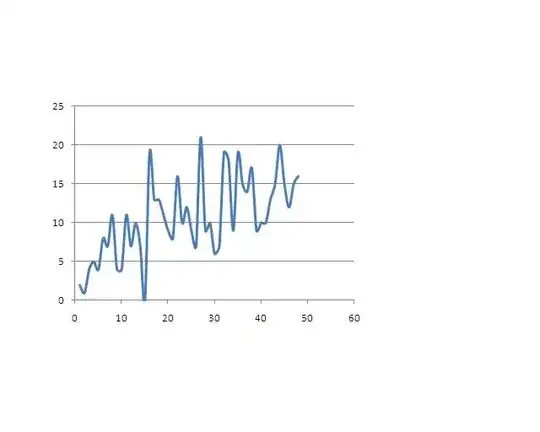 Here is the data:
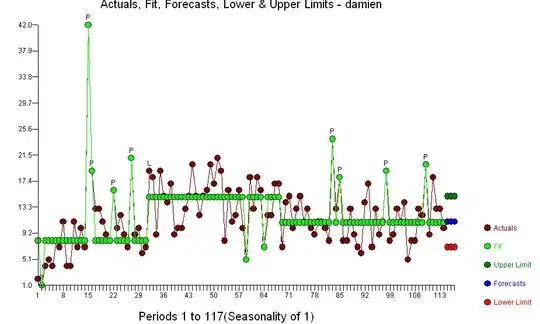 . The acf of the original series shows little structure
 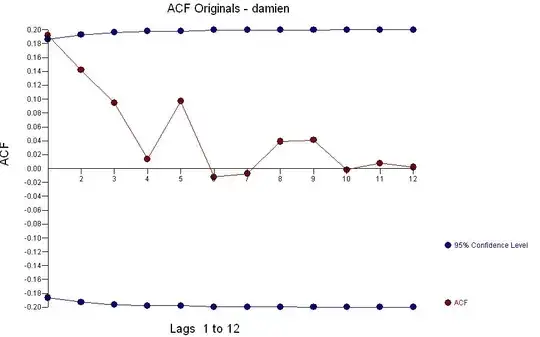 . The "best model" contains no ARIMA structure but evidences a few unusual data points and three distinct means or GROUPS [1-32 ; 33-69 ; 70-114 ]
 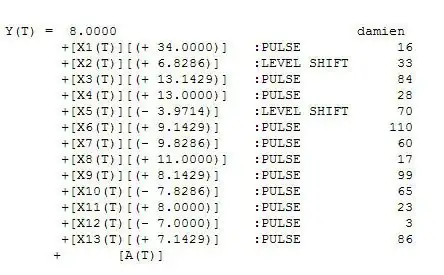 with outliers
 ![enter image description here] .[4] . The acf of the residuals suggests randomness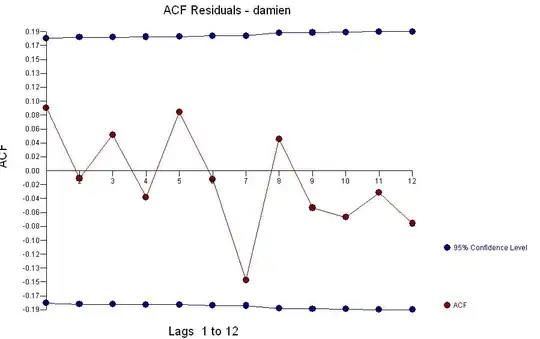 . What we have here are three arima models of the form (0,0,0)(0,0,0) with three different means or regimes XBAR1=8.0 ; XBAR2=14.826 and XBAR3=10.8572. One could consider this single-dimension cluster analysis (see